Cisco 2010 Annual Report Download - page 12
Download and view the complete annual report
Please find page 12 of the 2010 Cisco annual report below. You can navigate through the pages in the report by either clicking on the pages listed below, or by using the keyword search tool below to find specific information within the annual report.-
 1
1 -
 2
2 -
 3
3 -
 4
4 -
 5
5 -
 6
6 -
 7
7 -
 8
8 -
 9
9 -
 10
10 -
 11
11 -
 12
12 -
 13
13 -
 14
14 -
 15
15 -
 16
16 -
 17
17 -
 18
18 -
 19
19 -
 20
20 -
 21
21 -
 22
22 -
23
-
24
-
25
-
26
-
27
-
28
-
29
-
30
-
31
-
32
-
33
-
34
-
35
-
36
-
37
-
38
-
39
-
40
-
41
-
42
-
43
-
44
-
45
-
46
-
47
-
48
-
49
-
50
-
51
-
52
-
53
-
54
-
55
-
56
-
57
-
58
-
59
-
60
-
61
-
62
-
63
-
64
-
65
-
66
-
67
-
68
-
69
-
70
-
71
-
72
-
73
-
74
-
75
-
76
-
77
-
78
-
79
-
80
-
81
-
82
-
83
-
84
 |
 |
Management’s Discussion and Analysis of Financial Condition and Results of Operations
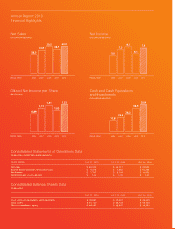
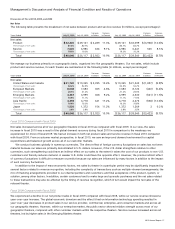
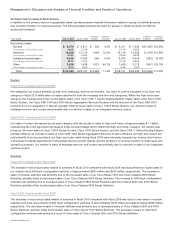
Revenue
We experienced a return to growth in net sales in fiscal 2010 as net sales increased by approximately 11% compared with fiscal
2009. The increase was experienced across all of our geographic theaters with net sales growth of 12% in the United States and
Canada, 17% in Asia Pacific, 11% in Japan, 9% in Emerging Markets, and 5% in our European Markets theater. From a customer
market perspective, in fiscal 2010, we saw an improved demand environment for capital expenditures across all of our customer
markets. While we cannot quantify with precision the impact to revenue of the extra week in fiscal 2010, we believe the extra week
added approximately 1% to our year-over-year revenue growth for fiscal 2010.
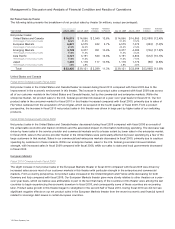
In fiscal 2010, net product sales increased 11% on a year-over-year basis, with increases across almost all of our categories of
similar products. Sales of router products increased in fiscal 2010 due to increased sales of our high-end routers offset partially by
lower sales within our mid-range and low-end router product categories. In fiscal 2010, the increase in sales of switching products
was driven by higher sales of both our modular and fixed-configuration switches. The increase in sales of advanced technology
products was a result of growth in unified communications, security, wireless, and storage, partially offset by a decline in sales of
video systems, networked home and application networking services. The year-over-year revenue increase in the other product
revenue category benefited from the inclusion of revenue from our acquisition of Pure Digital Technologies, Inc. (“Pure Digital”),
which we acquired in the fourth quarter of fiscal 2009, and Tandberg, which we acquired in the third quarter of fiscal 2010.
Additionally, the other product revenue category experienced increases from sales of cable products and Cisco Unified Computing
System. Net service revenue increased by 9% compared with fiscal 2009, reflecting increased service revenue across all of our
geographic theaters. From a service offering perspective, both technical support services and advanced services experienced
revenue increases from the prior fiscal year.
We believe the increase in revenue for fiscal 2010 reflected the improved global economic environment in fiscal 2010,
compared with what we experienced in fiscal 2009. However, as of the end of fiscal 2010 and entering fiscal 2011, we believe an
accurate characterization of the global economic environment is that it is uncertain.
Gross Margin
In fiscal 2010, our gross margin percentage increased by 0.1 percentage points compared with fiscal 2009, driven by a slightly
higher product gross margin percentage coupled with an unchanged service gross margin percentage. The higher product gross
margin percentage was primarily due to lower overall manufacturing costs, higher shipment volume, and favorable product mix.
Partially offsetting the product gross margin increase were higher sales discounts and rebates, and lower product pricing. The
service gross margin percentage remained unchanged from period to period with the increase in gross margin from technical
support services being offset by a decline in gross margin for advanced services. Our product and service gross margins may be
impacted by uncertain economic conditions as well as our movement into market adjacencies and could decline if any of the factors
that impact our gross margins are adversely affected in future periods.
Operating Expenses
During fiscal 2010, operating expenses increased in absolute dollars but decreased as a percentage of revenue, compared with
fiscal 2009. The increase in absolute dollars was attributable to higher headcount-related expenses, including variable
compensation expenses, higher discretionary expenses, and higher share-based compensation expense. The extra week in fiscal
2010 also contributed approximately $150 million to the year-over-year increase in total operating expenses during fiscal 2010.
Other Key Financial Measures
The following is a summary of our other key financial measures for fiscal 2010:
• We generated cash flows from operations of $10.2 billion in fiscal 2010, compared with $9.9 billion in fiscal 2009. Our cash and
cash equivalents, together with our investments, were $39.9 billion at the end of fiscal 2010, compared with $35.0 billion at the
end of fiscal 2009.
• Our total deferred revenue at the end of 2010 was $11.1 billion, compared with $9.4 billion at the end of fiscal 2009.
• We repurchased approximately 325 million shares of our common stock at an average price of $24.02 per share for an aggregate
purchase price of $7.8 billion during fiscal 2010. As of the end of fiscal 2010, the remaining authorized repurchase amount under
the stock repurchase program was $7.0 billion with no termination date.
• Days sales outstanding in accounts receivable (DSO) at the end of fiscal 2010 was 41 days, compared with 34 days at the end of
fiscal 2009.
• Our inventory balance was $1.3 billion at the end of fiscal 2010, compared with $1.1 billion at the end of fiscal 2009. Annualized
inventory turns were 12.6 in the fourth quarter of fiscal 2010, compared with 11.7 in the fourth quarter of fiscal 2009. Our
purchase commitments with contract manufacturers and suppliers were $4.3 billion at the end of fiscal 2010, compared with
$2.0 billion at the end of fiscal 2009.
10 Cisco Systems, Inc.