Cisco 2010 Annual Report Download - page 25
Download and view the complete annual report
Please find page 25 of the 2010 Cisco annual report below. You can navigate through the pages in the report by either clicking on the pages listed below, or by using the keyword search tool below to find specific information within the annual report.-
 1
1 -
2
-
3
-
4
-
5
-
6
-
7
-
8
-
9
-
10
-
11
-
12
-
13
-
14
-
 15
15 -
 16
16 -
 17
17 -
 18
18 -
 19
19 -
 20
20 -
 21
21 -
 22
22 -
 23
23 -
 24
24 -
 25
25 -
 26
26 -
 27
27 -
 28
28 -
 29
29 -
 30
30 -
 31
31 -
 32
32 -
 33
33 -
 34
34 -
 35
35 -
36
-
37
-
38
-
39
-
40
-
41
-
42
-
43
-
44
-
45
-
46
-
47
-
48
-
49
-
50
-
51
-
52
-
53
-
54
-
55
-
56
-
57
-
58
-
59
-
60
-
61
-
62
-
63
-
64
-
65
-
66
-
67
-
68
-
69
-
70
-
71
-
72
-
73
-
74
-
75
-
76
-
77
-
78
-
79
-
80
-
81
-
82
-
83
-
84
 |
 |

Management’s Discussion and Analysis of Financial Condition and Results of Operations
Product Gross Margin
Fiscal 2010 Compared with Fiscal 2009
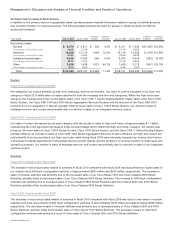
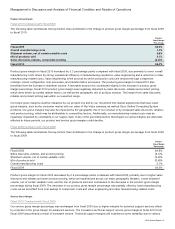
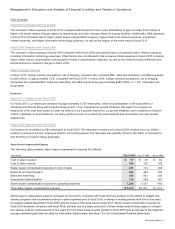
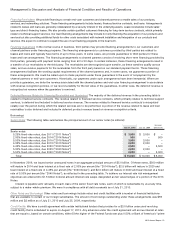
The following table summarizes the key factors that contributed to the change in product gross margin percentage from fiscal 2009
to fiscal 2010:
Product
Gross Margin
Percentage
Fiscal 2009 64.0%
Overall manufacturing costs 1.7%
Shipment volume, net of certain variable costs 0.6%
Mix of products sold 0.1%
Sales discounts, rebates, and product pricing (2.2)%
Fiscal 2010 64.2%
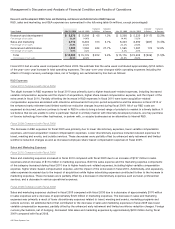
Product gross margin for fiscal 2010 increased by 0.2 percentage points compared with fiscal 2009, due primarily to lower overall
manufacturing costs driven by strong operational efficiency in manufacturing operations, value engineering and a reduction in other
manufacturing-related costs. Value engineering is the process by which production costs are reduced through component
redesign, board configuration, test processes, and transformation processes. The product gross margin for fiscal 2010 also
benefited from the increase in shipment volume. A favorable product mix contributed slightly to the increase in product gross
margin percentage. Fiscal 2010 product gross margin was negatively impacted by sales discounts, rebates and product pricing,
which were driven by normal market factors, as well as the geographic mix of product revenue. The impact from sales discounts,
rebates and product pricing was within our expected range.
Our future gross margins could be impacted by our product mix and by our movement into market adjacencies that have lower
gross margins, such as the consumer market with our sales of Flip Video cameras, as well as Cisco Unified Computing System
products. Our gross margins may also be impacted by the geographic mix of our revenue or by increased sales discounts, rebates,
and product pricing, which may be attributable to competitive factors. Additionally, our manufacturing-related costs may be
negatively impacted by constraints in our supply chain. If any of the preceding factors that impact our gross margins are adversely
affected in future periods, our product and service gross margins could decline.
Fiscal 2009 Compared with Fiscal 2008
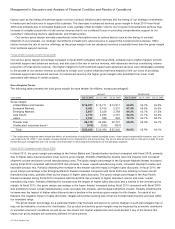
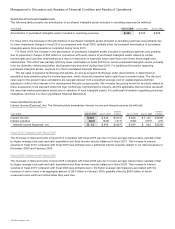
The following table summarizes the key factors that contributed to the change in product gross margin percentage from fiscal 2008
to fiscal 2009:
Product
Gross Margin
Percentage
Fiscal 2008 64.8%
Sales discounts, rebates, and product pricing (2.1)%
Shipment volume, net of certain variable costs (0.4)%
Mix of products sold (0.4)%
Overall manufacturing costs 2.1%
Fiscal 2009 64.0%
Product gross margin for fiscal 2009 decreased by 0.8 percentage points compared with fiscal 2008, primarily due to higher sales
discounts and rebates and lower product pricing, which we experienced across our major geographic theaters. Lower shipment
volume, net of certain variable costs, and the mix of products sold also contributed to the decrease in the product gross margin
percentage during fiscal 2009. The decrease in our product gross margin percentage was partially offset by lower manufacturing
costs, as we benefited from cost savings in component costs and value engineering and other manufacturing-related costs.
Service Gross Margin
Fiscal 2010 Compared with Fiscal 2009
Our service gross margin percentage was unchanged from fiscal 2009 due to higher margins for technical support services offset
by a decline in the gross margin for advanced services. The increase in technical support service gross margin in fiscal 2010 from
fiscal 2009 was primarily a result of increased volume. Technical support margins will experience some variability due to various
2010 Annual Report 23