Cisco 2010 Annual Report Download - page 71
Download and view the complete annual report
Please find page 71 of the 2010 Cisco annual report below. You can navigate through the pages in the report by either clicking on the pages listed below, or by using the keyword search tool below to find specific information within the annual report.-
 1
1 -
2
-
3
-
4
-
5
-
6
-
7
-
8
-
9
-
10
-
11
-
12
-
13
-
14
-
15
-
16
-
17
-
18
-
19
-
20
-
21
-
22
-
23
-
24
-
25
-
26
-
27
-
28
-
29
-
30
-
31
-
32
-
33
-
34
-
35
-
36
-
37
-
38
-
39
-
40
-
41
-
42
-
43
-
44
-
45
-
46
-
47
-
48
-
49
-
50
-
51
-
52
-
53
-
54
-
55
-
56
-
57
-
58
-
59
-
60
-
 61
61 -
 62
62 -
 63
63 -
 64
64 -
 65
65 -
 66
66 -
 67
67 -
 68
68 -
 69
69 -
 70
70 -
 71
71 -
 72
72 -
 73
73 -
 74
74 -
 75
75 -
 76
76 -
 77
77 -
 78
78 -
 79
79 -
 80
80 -
 81
81 -
82
-
83
-
84
 |
 |
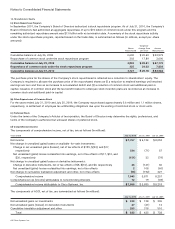
Notes to Consolidated Financial Statements
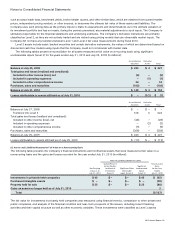
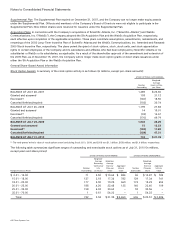
The aggregate intrinsic value in the preceding table represents the total pretax intrinsic value, based on the Company’s closing
stock price of $23.07 as of July 30, 2010, which would have been received by the option holders had those option holders
exercised their stock options as of that date. The total number of in-the-money stock options exercisable as of July 31, 2010 was
500 million. As of July 25, 2009, 768 million outstanding stock options were exercisable and the weighted-average exercise price
was $24.16.
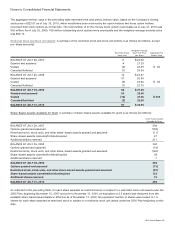
Restricted Stock and Stock Unit Awards A summary of the restricted stock and stock unit activity is as follows (in millions, except
per-share amounts):
Restricted Stock/
Stock Units
Weighted-Average
Grant Date Price
per Share
Aggregated Fair
Market Value
BALANCE AT JULY 28, 2007 11 $ 22.52
Granted and assumed 4 27.29
Vested (4) 22.49 $ 83
Canceled/forfeited (1) 24.24
BALANCE AT JULY 26, 2008 10 $ 24.27
Granted and assumed 57 20.90
Vested (4) 23.56 $ 69
Canceled/forfeited (1) 22.76
BALANCE AT JULY 25, 2009 62 $ 21.25
Granted and assumed 54 23.40
Vested (16) 21.56 $ 378
Canceled/forfeited (3) 22.40
BALANCE AT JULY 31, 2010 97 $ 22.35
Share-Based Awards Available for Grant A summary of share-based awards available for grant is as follows (in millions):
Share-Based Awards
Available for Grant
BALANCE AT JULY 28, 2007 294
Options granted and assumed (159)
Restricted stock, stock units, and other share-based awards granted and assumed (11)
Share-based awards canceled/forfeited/expired 27
Additional shares reserved 211
BALANCE AT JULY 26, 2008 362
Options granted and assumed (14)
Restricted stock, stock units, and other share-based awards granted and assumed (140)
Share-based awards canceled/forfeited/expired 38
Additional shares reserved 7
BALANCE AT JULY 25, 2009 253
Options granted and assumed (15)
Restricted stock, stock units, and other share-based awards granted and assumed (81)
Share-based awards canceled/forfeited/expired 123
Additional shares reserved 15
BALANCE AT JULY 31, 2010 295
As reflected in the preceding table, for each share awarded as restricted stock or subject to a restricted stock unit award under the
2005 Plan, beginning November 15, 2007 and prior to November 12, 2009, an equivalent of 2.5 shares was deducted from the
available share-based award balance. Effective as of November 12, 2009, the equivalent number of shares was revised to 1.5
shares for each share awarded as restricted stock or subject to a restricted stock unit award under the 2005 Plan beginning on this
date.
2010 Annual Report 69