Cisco 2010 Annual Report Download - page 28
Download and view the complete annual report
Please find page 28 of the 2010 Cisco annual report below. You can navigate through the pages in the report by either clicking on the pages listed below, or by using the keyword search tool below to find specific information within the annual report.-
 1
1 -
2
-
3
-
4
-
5
-
6
-
7
-
8
-
9
-
10
-
11
-
12
-
13
-
14
-
15
-
16
-
17
-
 18
18 -
 19
19 -
 20
20 -
 21
21 -
 22
22 -
 23
23 -
 24
24 -
 25
25 -
 26
26 -
 27
27 -
 28
28 -
 29
29 -
 30
30 -
 31
31 -
 32
32 -
 33
33 -
 34
34 -
 35
35 -
 36
36 -
 37
37 -
 38
38 -
39
-
40
-
41
-
42
-
43
-
44
-
45
-
46
-
47
-
48
-
49
-
50
-
51
-
52
-
53
-
54
-
55
-
56
-
57
-
58
-
59
-
60
-
61
-
62
-
63
-
64
-
65
-
66
-
67
-
68
-
69
-
70
-
71
-
72
-
73
-
74
-
75
-
76
-
77
-
78
-
79
-
80
-
81
-
82
-
83
-
84
 |
 |
Management’s Discussion and Analysis of Financial Condition and Results of Operations
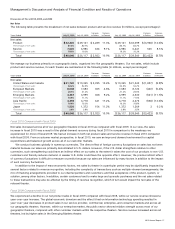
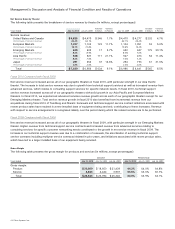
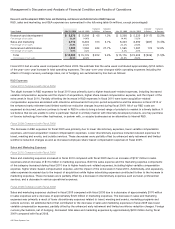
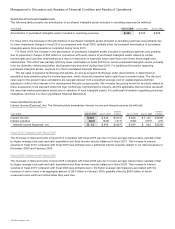
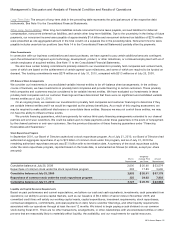
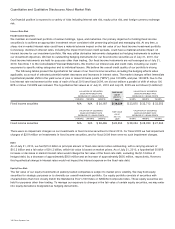
Research and Development (R&D), Sales and Marketing, and General and Administrative (G&A) Expenses
R&D, sales and marketing, and G&A expenses are summarized in the following table (in millions, except percentages):
Years Ended July 31, 2010 July 25, 2009
Variance
in Dollars
Variance
in Percent July 25, 2009 July 26, 2008
Variance
in Dollars
Variance
in Percent
Research and development $ 5,273 $ 5,208 $ 65 1.2% $ 5,208 $ 5,325 $ (117) (2.2)%
Percentage of net sales 13.2% 14.4% 14.4% 13.5%
Sales and marketing 8,716 8,403 313 3.7% 8,403 8,690 (287) (3.3)%
Percentage of net sales 21.8% 23.3% 23.3% 22.0%
General and administrative 1,999 1,565 434 27.7% 1,565 1,387 178 12.8%
Percentage of net sales 5.0% 4.3% 4.3% 3.5%
Total $ 15,988 $ 15,176 $ 812 5.4% $ 15,176 $ 15,402 $ (226) (1.5)%
Percentage of net sales 39.9% 42.0% 42.0% 39.0%
Fiscal 2010 had an extra week compared with fiscal 2009. We estimate that the extra week contributed approximately $150 million
of the year-over-year increase in total operating expenses. The year-over-year changes within operating expenses including the
effects of foreign currency exchange rates, net of hedging, are summarized by line item as follows:
R&D Expenses
Fiscal 2010 Compared with Fiscal 2009
The slight increase in R&D expenses for fiscal 2010 was primarily due to higher headcount-related expenses, including increased
variable compensation expense and the impact of acquisitions, higher share-based compensation expense, and the impact of the
extra week in fiscal 2010. Partially offsetting the increase in R&D expenses in fiscal 2010 were lower acquisition-related
compensation expenses associated with milestone achievements from prior period acquisitions and the absence in fiscal 2010 of
the enhanced early retirement and limited workforce reduction charges incurred during fiscal 2009. All of our R&D costs are
expensed as incurred, and we continue to invest in R&D in order to bring a broad range of products to market in a timely fashion. If
we believe that we are unable to enter a particular market in a timely manner with internally developed products, we may purchase
or license technology from other businesses, or partner with, or acquire businesses as an alternative to internal R&D.
Fiscal 2009 Compared with Fiscal 2008
The decrease in R&D expenses for fiscal 2009 was primarily due to lower discretionary expenses, lower variable compensation
expenses, and lower acquisition-related compensation expenses. Lower discretionary expenses included reduced expenses for
travel, meeting and events, and outside services. These decreases were partially offset by enhanced early retirement and limited
workforce reduction charges as well as increased employee share-based compensation expenses in fiscal 2009.
Sales and Marketing Expenses
Fiscal 2010 Compared with Fiscal 2009
Sales and marketing expenses increased in fiscal 2010 compared with fiscal 2009 due to an increase of $197 million in sales
expenses and an increase of $116 million in marketing expenses. Both the sales expense and the marketing expense components
of the category increased during fiscal 2010 due to higher headcount-related expenses, including higher variable compensation
expense, higher share-based compensation expense, and the impact of the extra week in fiscal 2010. Additionally, and separately,
sales expenses increased due to the impact of acquisitions while higher advertising expenses contributed further to the increase in
marketing expenses. These increases were partially offset by a decrease in discretionary expenses such as travel, professional
services, and a decrease in various operational expenses.
Fiscal 2009 Compared with Fiscal 2008
Sales and marketing expenses declined in fiscal 2009 compared with fiscal 2008 due to a decrease of approximately $170 million
in sales expenses and a decrease of approximately $120 million in marketing expenses. The decrease in sales and marketing
expenses was primarily a result of lower discretionary expenses related to travel, meeting and events, marketing programs and
outside services. An additional factor that contributed to the decrease in sales and marketing expenses in fiscal 2009 was lower
variable compensation expenses, partially offset by the enhanced early retirement and limited workforce reduction charges. Foreign
currency fluctuations, net of hedging, decreased total sales and marketing expenses by approximately $200 million during fiscal
2009 compared with fiscal 2008.
26 Cisco Systems, Inc.