Cisco 2010 Annual Report Download - page 30
Download and view the complete annual report
Please find page 30 of the 2010 Cisco annual report below. You can navigate through the pages in the report by either clicking on the pages listed below, or by using the keyword search tool below to find specific information within the annual report.-
 1
1 -
2
-
3
-
4
-
5
-
6
-
7
-
8
-
9
-
10
-
11
-
12
-
13
-
14
-
15
-
16
-
17
-
18
-
19
-
 20
20 -
 21
21 -
 22
22 -
 23
23 -
 24
24 -
 25
25 -
 26
26 -
 27
27 -
 28
28 -
 29
29 -
 30
30 -
 31
31 -
 32
32 -
 33
33 -
 34
34 -
 35
35 -
 36
36 -
 37
37 -
 38
38 -
 39
39 -
 40
40 -
41
-
42
-
43
-
44
-
45
-
46
-
47
-
48
-
49
-
50
-
51
-
52
-
53
-
54
-
55
-
56
-
57
-
58
-
59
-
60
-
61
-
62
-
63
-
64
-
65
-
66
-
67
-
68
-
69
-
70
-
71
-
72
-
73
-
74
-
75
-
76
-
77
-
78
-
79
-
80
-
81
-
82
-
83
-
84
 |
 |
Management’s Discussion and Analysis of Financial Condition and Results of Operations
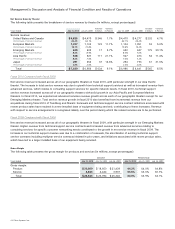
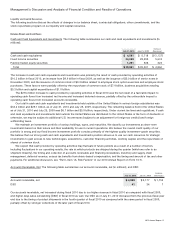
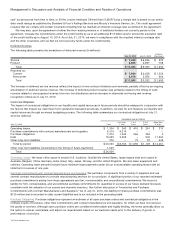
Amortization of Purchased Intangible Assets
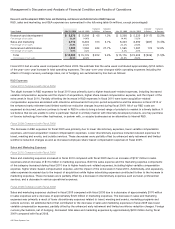
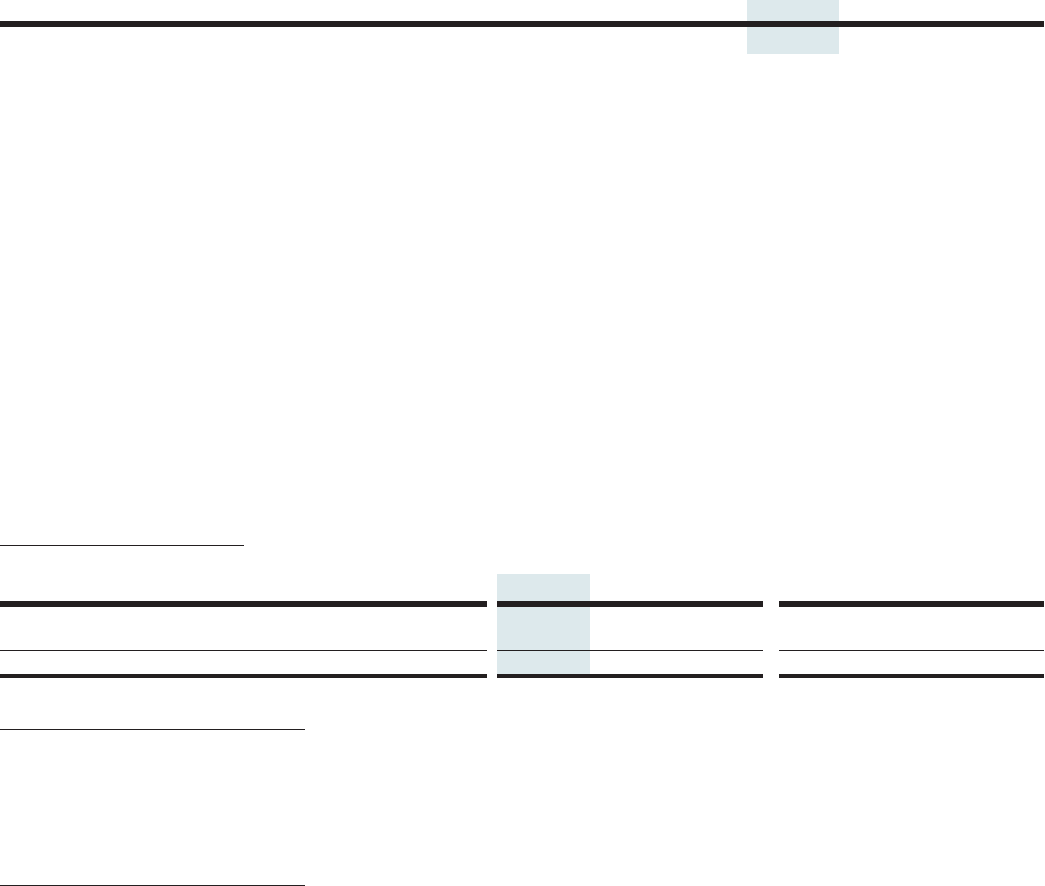
The following table presents the amortization of purchased intangible assets included in operating expenses (in millions):
Years Ended July 31, 2010 July 25, 2009 July 26, 2008
Amortization of purchased intangible assets included in operating expenses $ 491 $ 533 $ 499
For fiscal 2010, the decrease in the amortization of purchased intangible assets included in operating expenses was primarily due
to lower impairment charges in fiscal 2010 as compared with fiscal 2009, partially offset by increased amortization of purchased
intangible assets from acquisitions completed during fiscal 2010.
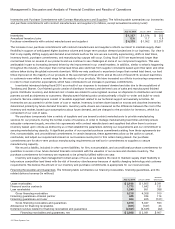
For fiscal 2009, the increase in the amortization of purchased intangible assets included in operating expenses was primarily
due to impairment charges of $95 million in connection with write-downs of purchased intangible assets related to certain
technologies and customer relationships as a result of reductions in expected future cash flows from those technologies and
relationships. This effect was partially offset by lower amortization in fiscal 2009 from certain purchased intangible assets, primarily
from the Scientific-Atlanta acquisition, that became fully amortized during fiscal 2009. For additional information regarding
purchased intangible assets, see Note 4 to the Consolidated Financial Statements.
The fair value of acquired technology and patents, as well as acquired technology under development, is determined at
acquisition date primarily using the income approach, which discounts expected future cash flows to present value. The discount
rates used in the present value calculations are typically derived from a weighted-average cost of capital analysis and then
adjusted to reflect risks inherent in the development lifecycle as appropriate. We consider the pricing model for products related to
these acquisitions to be standard within the high-technology communications industry, and the applicable discount rates represent
the rates that market participants would use for valuation of such intangible assets. For additional information regarding purchased
intangibles, see Note 4 to the Consolidated Financial Statements.
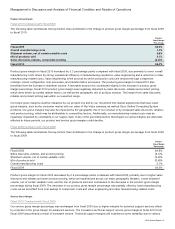
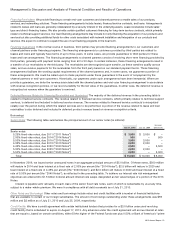
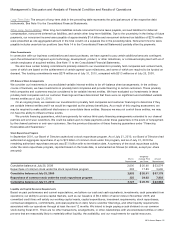
Interest and Other Income, Net
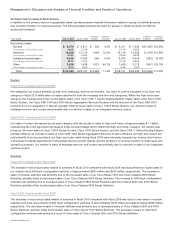
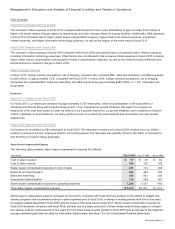
Interest Income (Expense), Net The following table summarizes interest income and interest expense (in millions):
Years Ended July 31, 2010 July 25, 2009
Variance
in Dollars July 25, 2009 July 26, 2008
Variance
in Dollars
Interest income $ 635 $ 845 $ (210) $ 845 $ 1,143 $ (298)
Interest expense (623) (346) (277) (346) (319) (27)
Interest income (expense), net $12 $ 499 $ (487) $ 499 $ 824 $ (325)
Fiscal 2010 Compared with Fiscal 2009
The decrease in interest income in fiscal 2010 compared with fiscal 2009 was due to lower average interest rates, partially offset
by higher average total cash and cash equivalents and fixed income security balances in fiscal 2010. The increase in interest
expense in fiscal 2010 compared with fiscal 2009 was primarily due to additional interest expense related to our debt issuances in
November 2009 and February 2009.
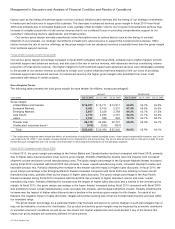
Fiscal 2009 Compared with Fiscal 2008
The decrease in interest income in fiscal 2009 compared with fiscal 2008 was due to lower average interest rates, partially offset
by higher average total cash and cash equivalents and fixed income security balances in fiscal 2009. The increase in interest
expense in fiscal 2009 compared with fiscal 2008 was primarily due to the higher average debt balances associated with the
issuance of senior notes in an aggregate amount of $4.0 billion in February 2009, partially offset by $500 million of senior
unsecured notes which we retired when they were due.
28 Cisco Systems, Inc.