Cisco 2010 Annual Report Download - page 24
Download and view the complete annual report
Please find page 24 of the 2010 Cisco annual report below. You can navigate through the pages in the report by either clicking on the pages listed below, or by using the keyword search tool below to find specific information within the annual report.-
 1
1 -
2
-
3
-
4
-
5
-
6
-
7
-
8
-
9
-
10
-
11
-
12
-
13
-
 14
14 -
 15
15 -
 16
16 -
 17
17 -
 18
18 -
 19
19 -
 20
20 -
 21
21 -
 22
22 -
 23
23 -
 24
24 -
 25
25 -
 26
26 -
 27
27 -
 28
28 -
 29
29 -
 30
30 -
 31
31 -
 32
32 -
 33
33 -
 34
34 -
35
-
36
-
37
-
38
-
39
-
40
-
41
-
42
-
43
-
44
-
45
-
46
-
47
-
48
-
49
-
50
-
51
-
52
-
53
-
54
-
55
-
56
-
57
-
58
-
59
-
60
-
61
-
62
-
63
-
64
-
65
-
66
-
67
-
68
-
69
-
70
-
71
-
72
-
73
-
74
-
75
-
76
-
77
-
78
-
79
-
80
-
81
-
82
-
83
-
84
 |
 |

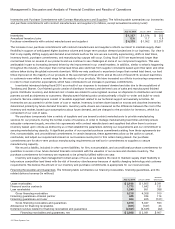
Management’s Discussion and Analysis of Financial Condition and Results of Operations
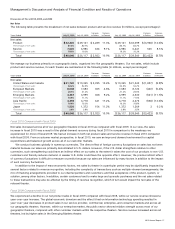
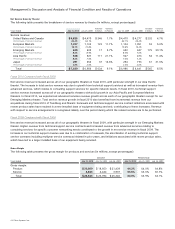
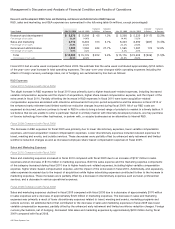
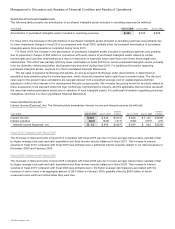
Net Service Sales by Theater
The following table presents the breakdown of service revenue by theater (in millions, except percentages):
Years Ended July 31, 2010 July 25, 2009
Variance
in Dollars
Variance
in Percent July 25, 2009 July 26, 2008
Variance
in Dollars
Variance
in Percent
Service revenue:
United States and Canada $ 4,825 $ 4,479 $ 346 7.7% $ 4,479 $ 4,277 $ 202 4.7%
Percentage of service revenue 63.3% 64.1% 64.1% 66.4%
European Markets 1,227 1,104 123 11.1% 1,104 1,051 53 5.0%
Percentage of service revenue 16.1% 15.8% 15.8% 16.3%
Emerging Markets 639 622 17 2.7% 622 447 175 39.1%
Percentage of service revenue 8.4% 8.9% 8.9% 7.0%
Asia Pacific 638 527 111 21.1% 527 473 54 11.4%
Percentage of service revenue 8.4% 7.6% 7.6% 7.3%
Japan 291 254 37 14.6% 254 193 61 31.6%
Percentage of service revenue 3.8% 3.6% 3.6% 3.0%
Total $ 7,620 $ 6,986 $ 634 9.1% $ 6,986 $ 6,441 $ 545 8.5%
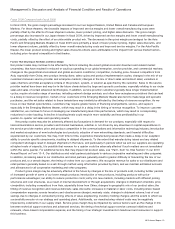
Fiscal 2010 Compared with Fiscal 2009
Net service revenue increased across all of our geographic theaters in fiscal 2010, with particular strength in our Asia Pacific
theater. The increase in total service revenue was due to growth from technical support services as well as increased revenue from
advanced services, which relates to consulting support services for specific network needs. In fiscal 2010, technical support
service revenue increased across all of our geographic theaters with solid growth in our Asia Pacific and European Markets
theaters. In fiscal 2010, we experienced advanced services revenue growth across each of our geographic theaters except for our
Emerging Markets theater. Total service revenue growth in fiscal 2010 also benefited from incremental revenue from our
acquisitions during fiscal 2010 of Tandberg and Starent. Renewals and technical support service contract initiations associated with
recent product sales have resulted in a new installed base of equipment being serviced, contributing to these increases. Revenue
with respect to service arrangements is recognized ratably over the period during which the related services are to be performed.
Fiscal 2009 Compared with Fiscal 2008
Net service revenue increased across all of our geographic theaters in fiscal 2009, with particular strength in our Emerging Markets
theater. Higher revenue from technical support service contracts and increased revenue from advanced services relating to
consulting services for specific customer networking needs contributed to the growth in net service revenue in fiscal 2009. The
increase in our technical support revenue was due to a combination of renewals, the amortization of existing technical support
service contracts including multiyear service contracts initiated in prior years, and initiations associated with recent product sales,
which have led to a larger installed base of our equipment being serviced.
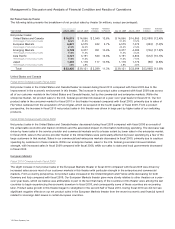
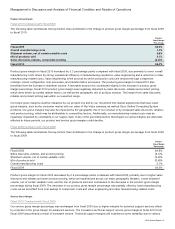
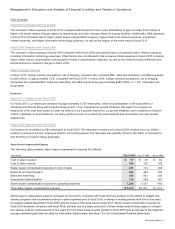
Gross Margin
The following table presents the gross margin for products and services (in millions, except percentages):
AMOUNT PERCENTAGE
Years Ended July 31, 2010 July 25, 2009 July 26, 2008 July 31, 2010 July 25, 2009 July 26, 2008
Gross margin:
Product $ 20,800 $ 18,650 $ 21,439 64.2% 64.0% 64.8%
Service 4,843 4,444 3,907 63.6% 63.6% 60.7%
Total $ 25,643 $ 23,094 $ 25,346 64.0% 63.9% 64.1%
22 Cisco Systems, Inc.