Cisco 2010 Annual Report Download - page 26
Download and view the complete annual report
Please find page 26 of the 2010 Cisco annual report below. You can navigate through the pages in the report by either clicking on the pages listed below, or by using the keyword search tool below to find specific information within the annual report.-
 1
1 -
2
-
3
-
4
-
5
-
6
-
7
-
8
-
9
-
10
-
11
-
12
-
13
-
14
-
15
-
 16
16 -
 17
17 -
 18
18 -
 19
19 -
 20
20 -
 21
21 -
 22
22 -
 23
23 -
 24
24 -
 25
25 -
 26
26 -
 27
27 -
 28
28 -
 29
29 -
 30
30 -
 31
31 -
 32
32 -
 33
33 -
 34
34 -
 35
35 -
 36
36 -
37
-
38
-
39
-
40
-
41
-
42
-
43
-
44
-
45
-
46
-
47
-
48
-
49
-
50
-
51
-
52
-
53
-
54
-
55
-
56
-
57
-
58
-
59
-
60
-
61
-
62
-
63
-
64
-
65
-
66
-
67
-
68
-
69
-
70
-
71
-
72
-
73
-
74
-
75
-
76
-
77
-
78
-
79
-
80
-
81
-
82
-
83
-
84
 |
 |
Management’s Discussion and Analysis of Financial Condition and Results of Operations
factors such as the timing of technical support service contract initiations and renewals and the timing of our strategic investments
in headcount and resources to support this business. The decrease in advanced services gross margin in fiscal 2010 from fiscal
2009 was primarily due to increased headcount costs, partially offset by higher volume. Our revenue from advanced services may
increase to a higher proportion of total service revenue due to our continued focus on providing comprehensive support to our
customers’ networking devices, applications, and infrastructures.
Our service gross margin normally experiences some fluctuations due to various factors such as the timing of contract
initiations in our renewals, our strategic investments in headcount, and resources to support the overall service business. Other
factors include the mix of service offerings, as the gross margin from our advanced services is typically lower than the gross margin
from technical support services.
Fiscal 2009 Compared with Fiscal 2008
Our service gross margin percentage increased in fiscal 2009 compared with fiscal 2008, primarily due to higher margins for both
technical support and advanced services, and also due to the mix of service revenue, with advanced services constituting a lower
proportion of total service revenue. The higher margins for both technical support and advanced services were attributable primarily
to the growth of our service revenue as well as to certain cost-control initiatives that have helped to limit our costs of providing
technical support and advanced services. For advanced services, the higher gross margins also benefited from lower costs
associated with delays in certain projects.
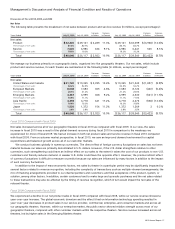
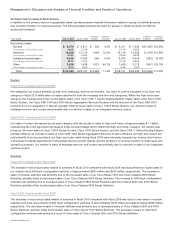
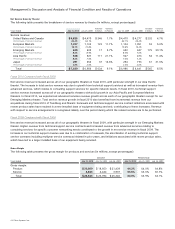
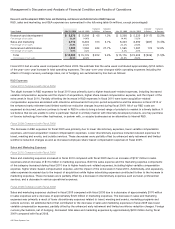
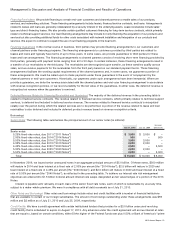
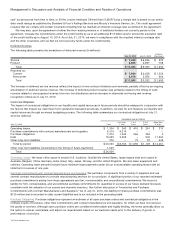
Gross Margin by Theater
The following table presents the total gross margin for each theater (in millions, except percentages):
AMOUNT PERCENTAGE
Years Ended July 31, 2010 July 25, 2009 July 26, 2008 July 31, 2010 July 25, 2009 July 26, 2008
Gross margin:
United States and Canada $ 14,077 $ 12,711 $ 13,917 64.8% 65.7% 65.5%
European Markets 5,421 5,106 5,331 67.4% 66.5% 65.6%
Emerging Markets 2,807 2,428 2,788 64.3% 60.7% 61.5%
Asia Pacific 2,713 2,293 2,751 62.2% 61.7% 64.3%
Japan 1,101 948 940 72.1% 69.1% 68.7%
Theater total 26,119 23,486 25,727 65.2% 65.0% 65.1%
Unallocated corporate items(1) (476) (392) (381)
Total $ 25,643 $ 23,094 $ 25,346 64.0% 63.9% 64.1%
(1) The unallocated corporate items include the effects of amortization of acquisition-related intangible assets; share-based compensation expense; and, for the
year ended July 25, 2009, it also includes charges related to asset impairments and restructurings. We do not allocate these items to the gross margin for each
theater because management does not include such information in measuring the performance of the operating segments.
Fiscal 2010 Compared with Fiscal 2009
In fiscal 2010, the gross margin percentage in the United States and Canada theater declined compared with fiscal 2009, primarily
due to higher sales discounts and a lower service gross margin. Partially offsetting the decline were the impacts from increased
shipment volume and lower overall manufacturing costs. The gross margin percentage in the European Markets theater increased
during fiscal 2010 compared with fiscal 2009 due primarily to lower overall manufacturing costs, increased shipment volume and
favorable product mix. Partially offsetting the increase in this theater was the impact of higher sales discounts. In fiscal 2010, the
gross margin percentage in the Emerging Markets theater increased compared with fiscal 2009 due primarily to lower overall
manufacturing costs, partially offset by the impact of higher sales discounts. The gross margin percentage in the Asia Pacific
theater increased during fiscal 2010 compared with fiscal 2009 due primarily to higher shipment volume and lower overall
manufacturing costs. Partially offsetting the increase was the impact of higher sales discounts and a decline in the services gross
margin. In fiscal 2010, the gross margin percentage in the Japan theater increased during fiscal 2010 compared with fiscal 2009
due primarily to lower overall manufacturing costs, favorable mix impacts, and increased shipment volume. Partially offsetting the
increase was the impact of higher sales discounts and a decline in the services gross margin for this theater. For each of our
theaters, the negative impact of sales discounts, rebates and product pricing was driven by normal market factors and was within
our expected range.
The gross margin percentage for a particular theater may fluctuate and period-to-period changes in such percentages may or
may not be indicative of a trend for that theater. Our product and service gross margins may be impacted by economic downturns
or uncertain economic conditions as well as our movement into market adjacencies and could decline if any of the factors that
impact our gross margins are adversely affected in future periods.
24 Cisco Systems, Inc.