Cisco 2010 Annual Report Download - page 36
Download and view the complete annual report
Please find page 36 of the 2010 Cisco annual report below. You can navigate through the pages in the report by either clicking on the pages listed below, or by using the keyword search tool below to find specific information within the annual report.-
 1
1 -
2
-
3
-
4
-
5
-
6
-
7
-
8
-
9
-
10
-
11
-
12
-
13
-
14
-
15
-
16
-
17
-
18
-
19
-
20
-
21
-
22
-
23
-
24
-
25
-
 26
26 -
 27
27 -
 28
28 -
 29
29 -
 30
30 -
 31
31 -
 32
32 -
 33
33 -
 34
34 -
 35
35 -
 36
36 -
 37
37 -
 38
38 -
 39
39 -
 40
40 -
 41
41 -
 42
42 -
 43
43 -
 44
44 -
 45
45 -
 46
46 -
47
-
48
-
49
-
50
-
51
-
52
-
53
-
54
-
55
-
56
-
57
-
58
-
59
-
60
-
61
-
62
-
63
-
64
-
65
-
66
-
67
-
68
-
69
-
70
-
71
-
72
-
73
-
74
-
75
-
76
-
77
-
78
-
79
-
80
-
81
-
82
-
83
-
84
 |
 |

Management’s Discussion and Analysis of Financial Condition and Results of Operations
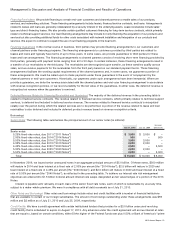
rate” as announced from time to time, or (ii) the London Interbank Offered Rate (“LIBOR”) plus a margin that is based on our senior
debt credit ratings as published by Standard & Poor’s Ratings Services and Moody’s Investors Service, Inc. The credit agreement
requires that we comply with certain covenants including that we maintain an interest coverage ratio as defined in the agreement.
We may also, upon the agreement of either the then-existing lenders or of additional lenders not currently parties to the
agreement, increase the commitments under the credit facility by up to an additional $1.9 billion and/or extend the expiration date
of the credit facility up to August 15, 2014. As of July 31, 2010, we were in compliance with the required interest coverage ratio
and the other covenants, and we had not borrowed any funds under the credit facility.
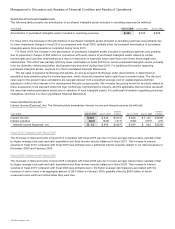
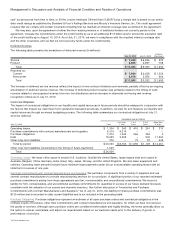
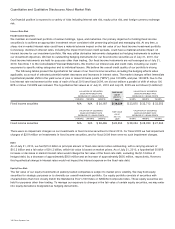
Deferred Revenue
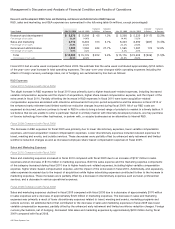
The following table presents the breakdown of deferred revenue (in millions):
July 31, 2010 July 25, 2009
Increase
(Decrease)
Service $ 7,428 $ 6,496 $ 932
Product 3,655 2,897 758
Total $ 11,083 $ 9,393 $ 1,690
Reported as:
Current $ 7,664 $ 6,438 $ 1,226
Noncurrent 3,419 2,955 464
Total $ 11,083 $ 9,393 $ 1,690
The increase in deferred service revenue reflects the impact of new contract initiations and renewals, partially offset by an ongoing
amortization of deferred service revenue. The increase in deferred product revenue was primarily related to the timing of cash
receipts related to unrecognized revenue from two-tier distributors and an increase in shipments not having met revenue
recognition criteria as of July 31, 2010.
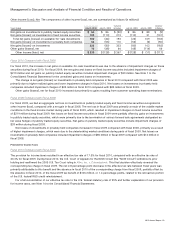
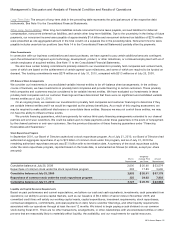
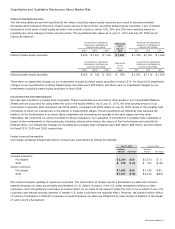
Contractual Obligations
The impact of contractual obligations on our liquidity and capital resources in future periods should be analyzed in conjunction with
the factors that impact our cash flows from operations discussed previously. In addition, we plan for and measure our liquidity and
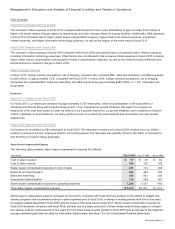
capital resources through an annual budgeting process. The following table summarizes our contractual obligations at July 31,
2010 (in millions):
PAYMENTS DUE BY PERIOD
July 31, 2010 Total
Less than
1 Year
1to3
Years
3to5
Years
More than
5 Years
Operating leases $ 1,304 $ 343 $ 410 $ 241 $ 310
Purchase commitments with contract manufacturers and suppliers 4,319 4,319 — — —
Purchase obligations 1,972 1,044 566 356 6
Debt 15,059 3,059 — 500 11,500
Other long-term liabilities 376 — 79 52 245
Total by period $ 23,030 $ 8,765 $ 1,055 $ 1,149 $ 12,061
Other long-term liabilities (uncertainty in the timing of future payments) 1,629
Total $ 24,659
Operating Leases We lease office space in several U.S. locations. Outside the United States, larger leased sites are located in
Australia, Belgium, China, Germany, India, Israel, Italy, Japan, Norway, and the United Kingdom. We also lease equipment and
vehicles. Operating lease amounts include future minimum lease payments under all our noncancelable operating leases with an
initial term in excess of one year.
Purchase Commitments with Contract Manufacturers and Suppliers We purchase components from a variety of suppliers and use
several contract manufacturers to provide manufacturing services for our products. A significant portion of our reported estimated
purchase commitments arising from these agreements are firm, noncancelable, and unconditional commitments. We record a
liability for firm, noncancelable, and unconditional purchase commitments for quantities in excess of our future demand forecasts
consistent with the valuation of our excess and obsolete inventory. See further discussion in “Inventories and Purchase
Commitments with Contract Manufacturers and Suppliers.” As of July 31, 2010, the liability for these purchase commitments was
$135 million and is recorded in other current liabilities and is not included in the preceding table.
Purchase Obligations Purchase obligations represent an estimate of all open purchase orders and contractual obligations in the
ordinary course of business, other than commitments with contract manufacturers and suppliers, for which we have not received
the goods or services. Although open purchase orders are considered enforceable and legally binding, the terms generally allow us
the option to cancel, reschedule, and adjust our requirements based on our business needs prior to the delivery of goods or
performance of services.
34 Cisco Systems, Inc.