Cisco 2010 Annual Report Download - page 21
Download and view the complete annual report
Please find page 21 of the 2010 Cisco annual report below. You can navigate through the pages in the report by either clicking on the pages listed below, or by using the keyword search tool below to find specific information within the annual report.-
 1
1 -
2
-
3
-
4
-
5
-
6
-
7
-
8
-
9
-
10
-
 11
11 -
 12
12 -
 13
13 -
 14
14 -
 15
15 -
 16
16 -
 17
17 -
 18
18 -
 19
19 -
 20
20 -
 21
21 -
 22
22 -
 23
23 -
 24
24 -
 25
25 -
 26
26 -
 27
27 -
 28
28 -
 29
29 -
 30
30 -
 31
31 -
32
-
33
-
34
-
35
-
36
-
37
-
38
-
39
-
40
-
41
-
42
-
43
-
44
-
45
-
46
-
47
-
48
-
49
-
50
-
51
-
52
-
53
-
54
-
55
-
56
-
57
-
58
-
59
-
60
-
61
-
62
-
63
-
64
-
65
-
66
-
67
-
68
-
69
-
70
-
71
-
72
-
73
-
74
-
75
-
76
-
77
-
78
-
79
-
80
-
81
-
82
-
83
-
84
 |
 |

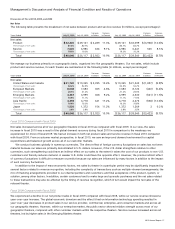
Management’s Discussion and Analysis of Financial Condition and Results of Operations
Fiscal 2009 Compared with Fiscal 2008
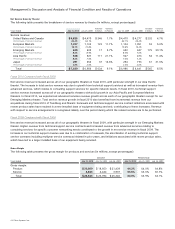
The decrease in net product sales in the European Markets theater in fiscal 2009 compared with fiscal 2008 was driven by lower
sales to the service provider, commercial, and enterprise markets. Despite a decline in sales in our overall enterprise market in this
theater, sales to the public sector showed strength relative to other customer markets within this theater. The decline in sales for
fiscal 2009 was experienced across the major countries in the European Markets theater, and particularly in the United Kingdom,
Italy, and Germany.
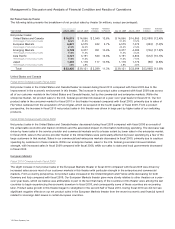
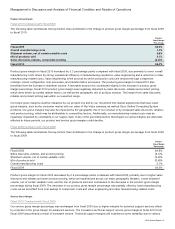
Emerging Markets
Fiscal 2010 Compared with Fiscal 2009
Net product sales in the Emerging Markets theater increased, primarily as a result of increased product sales across all of our
customer markets with the exception of the consumer market. We experienced a return to stronger year-over-year sales growth in
the second half of fiscal 2010, led by Brazil, Mexico, and Russia. Certain of our customers in the Emerging Markets theater tend to
make large and sporadic purchases, and the net sales related to these transactions may also be affected by the timing of revenue
recognition. Further, some customers may continue to require greater levels of financing arrangements, service, and support in
future periods, which may also impact the timing of recognition of the revenue for this theater.
Fiscal 2009 Compared with Fiscal 2008
Net product sales in the Emerging Markets theater decreased across all customer market segments in fiscal 2009 compared with
fiscal 2008, primarily due to lower sales to the service provider, commercial and enterprise markets. We also experienced a sales
decline in fiscal 2009 across most countries in this theater, with particular weakness in Russia, Brazil, and Mexico. In addition to the
impact from lower shipments, the decline in net product sales in this theater in fiscal 2009 was also due to the timing of revenue
recognition for sales involving financing arrangements.
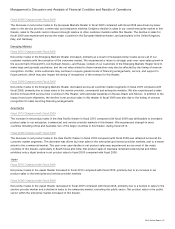
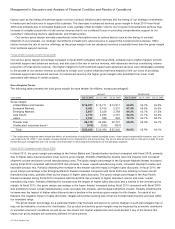
Asia Pacific
Fiscal 2010 Compared with Fiscal 2009
The increase in net product sales in the Asia Pacific theater in fiscal 2010 compared with fiscal 2009 was attributable to increased
product sales to our enterprise, commercial, and service provider markets in this theater. We experienced strength in most
countries including China and Australia, two of the larger countries in this theater, during fiscal 2010.
Fiscal 2009 Compared with Fiscal 2008
The decrease in net product sales in the Asia Pacific theater in fiscal 2009 compared with fiscal 2008 was reflected across all the
customer market segments. The decrease was driven by lower sales in the enterprise and service provider markets, and to a lesser
extent in the commercial market. The year-over-year decline in net product sales was experienced across most of the major
countries in this theater, particularly in South Korea and India. Net product sales in Australia remained relatively flat and China
exhibited only a slight decline in net product sales in fiscal 2009 compared with fiscal 2008.
Japan
Fiscal 2010 Compared with Fiscal 2009
Net product sales in the Japan theater increased in fiscal 2010 compared with fiscal 2009, primarily due to an increase in net
product sales to the enterprise and service provider markets.
Fiscal 2009 Compared with Fiscal 2008
Net product sales in the Japan theater decreased in fiscal 2009 compared with fiscal 2008, primarily due to a decline in sales to the
service provider market and a decline in sales to the enterprise market, excluding the public sector. Net product sales to the public
sector within the enterprise market increased in this theater.
2010 Annual Report 19