Cisco 2010 Annual Report Download - page 20
Download and view the complete annual report
Please find page 20 of the 2010 Cisco annual report below. You can navigate through the pages in the report by either clicking on the pages listed below, or by using the keyword search tool below to find specific information within the annual report.-
 1
1 -
2
-
3
-
4
-
5
-
6
-
7
-
8
-
9
-
 10
10 -
 11
11 -
 12
12 -
 13
13 -
 14
14 -
 15
15 -
 16
16 -
 17
17 -
 18
18 -
 19
19 -
 20
20 -
 21
21 -
 22
22 -
 23
23 -
 24
24 -
 25
25 -
 26
26 -
 27
27 -
 28
28 -
 29
29 -
 30
30 -
31
-
32
-
33
-
34
-
35
-
36
-
37
-
38
-
39
-
40
-
41
-
42
-
43
-
44
-
45
-
46
-
47
-
48
-
49
-
50
-
51
-
52
-
53
-
54
-
55
-
56
-
57
-
58
-
59
-
60
-
61
-
62
-
63
-
64
-
65
-
66
-
67
-
68
-
69
-
70
-
71
-
72
-
73
-
74
-
75
-
76
-
77
-
78
-
79
-
80
-
81
-
82
-
83
-
84
 |
 |

Management’s Discussion and Analysis of Financial Condition and Results of Operations
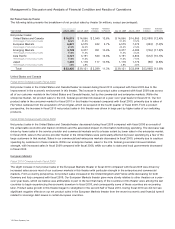
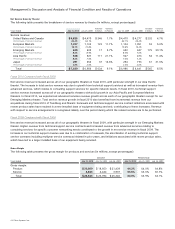
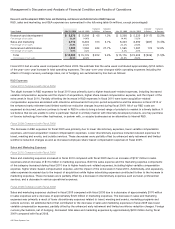
Net Product Sales by Theater
The following table presents the breakdown of net product sales by theater (in millions, except percentages):
Years Ended July 31, 2010 July 25, 2009
Variance
in Dollars
Variance
in Percent July 25, 2009 July 26, 2008
Variance
in Dollars
Variance
in Percent
Net product sales:
United States and Canada $ 16,915 $ 14,866 $ 2,049 13.8% $ 14,866 $ 16,965 $ (2,099) (12.4)%
Percentage of net product sales 52.2% 51.0% 51.0% 51.2%
European Markets 6,821 6,579 242 3.7% 6,579 7,072 (493) (7.0)%
Percentage of net product sales 21.0% 22.6% 22.6% 21.4%
Emerging Markets 3,728 3,377 351 10.4% 3,377 4,083 (706) (17.3)%
Percentage of net product sales 11.5% 11.6% 11.6% 12.3%
Asia Pacific 3,721 3,191 530 16.6% 3,191 3,803 (612) (16.1)%
Percentage of net product sales 11.5% 11.0% 11.0% 11.5%
Japan 1,235 1,118 117 10.5% 1,118 1,176 (58) (4.9)%
Percentage of net product sales 3.8% 3.8% 3.8% 3.6%
Total $ 32,420 $ 29,131 $ 3,289 11.3% $ 29,131 $ 33,099 $ (3,968) (12.0)%
United States and Canada
Fiscal 2010 Compared with Fiscal 2009
Net product sales in the United States and Canada theater increased during fiscal 2010 compared with fiscal 2009 due to the
improvement in the economic environment in this theater. The increase in net product sales compared with fiscal 2009 was across
all of our customer markets in the United States and Canada theater, led by the commercial and enterprise markets. Within the
enterprise market, net product sales to the U.S. federal government increased on a year-over-year basis for fiscal 2010. Our net
product sales in the consumer market for fiscal 2010 in this theater increased compared with fiscal 2009, primarily due to sales of
Flip Video cameras from the acquisition of Pure Digital, which we acquired in the fourth quarter of fiscal 2009. From a product
perspective, the increase in fiscal 2010 net product sales in this theater was driven in large part by higher sales of our switching
products.
Fiscal 2009 Compared with Fiscal 2008
Net product sales in the United States and Canada theater decreased during fiscal 2009 compared with fiscal 2008 as a result of
the unfavorable economic and market conditions and the associated impact on information technology spending. The decrease was
driven by lower sales in the service provider and commercial markets and to a lesser extent by lower sales in the enterprise market.
In fiscal 2009, sales in the service provider market in the United States were particularly affected by lower spending by a few of the
large customers in that market. Sales in our commercial and enterprise markets decreased in fiscal 2009, primarily due to cautious
spending by customers in these markets. Within our enterprise market, sales to the U.S. federal government showed relative
strength, with increased sales in fiscal 2009 compared with fiscal 2008, while our sales to state and local governments decreased
in fiscal 2009.
European Markets
Fiscal 2010 Compared with Fiscal 2009
The slight increase in net product sales in the European Markets theater in fiscal 2010 compared with fiscal 2009 was driven by
increased sales across most of our customer markets in this theater with particular strength in the enterprise and commercial
markets. From a country perspective, net product sales increased in the United Kingdom and France while decreasing for both
Germany and Italy compared with fiscal 2009. Our European Markets theater grew more slowly relative to other theaters on a year-
over-year basis, which we believe was attributable in part to the fact that many of the countries in this theater were among the last
countries to begin experiencing the economic downturn in fiscal 2009, and consequently some of these countries are recovering
later. Product sales growth in this theater began to strengthen in the second half of fiscal 2010. During fiscal 2010 we did not see
significant negative effects on our net product sales in the European Markets theater from the recent economic and financial turmoil
related to sovereign debt issues in certain European countries.
18 Cisco Systems, Inc.