Cisco 2010 Annual Report Download - page 10
Download and view the complete annual report
Please find page 10 of the 2010 Cisco annual report below. You can navigate through the pages in the report by either clicking on the pages listed below, or by using the keyword search tool below to find specific information within the annual report.-
 1
1 -
 2
2 -
 3
3 -
 4
4 -
 5
5 -
 6
6 -
 7
7 -
 8
8 -
 9
9 -
 10
10 -
 11
11 -
 12
12 -
 13
13 -
 14
14 -
 15
15 -
 16
16 -
 17
17 -
 18
18 -
 19
19 -
 20
20 -
 21
21 -
22
-
23
-
24
-
25
-
26
-
27
-
28
-
29
-
30
-
31
-
32
-
33
-
34
-
35
-
36
-
37
-
38
-
39
-
40
-
41
-
42
-
43
-
44
-
45
-
46
-
47
-
48
-
49
-
50
-
51
-
52
-
53
-
54
-
55
-
56
-
57
-
58
-
59
-
60
-
61
-
62
-
63
-
64
-
65
-
66
-
67
-
68
-
69
-
70
-
71
-
72
-
73
-
74
-
75
-
76
-
77
-
78
-
79
-
80
-
81
-
82
-
83
-
84
 |
 |

Management’s Discussion and Analysis of Financial Condition and Results of Operations
Forward-Looking Statements
The Management’s Discussion and Analysis of Financial Condition and Results of Operations contains forward-looking statements
regarding future events and our future results that are subject to the safe harbors created under the Securities Act of 1933 (the
“Securities Act”) and the Securities Exchange Act of 1934 (the “Exchange Act”). All statements other than statements of historical
facts are statements that could be deemed forward-looking statements. These statements are based on current expectations,
estimates, forecasts, and projections about the industries in which we operate and the beliefs and assumptions of our
management. Words such as “expects,” “anticipates,” “targets,” “goals,” “projects,” “intends,” “plans,” “believes,” “seeks,”
“estimates,” “continues,” “endeavors,” “strives,” “may,” variations of such words and similar expressions are intended to identify
such forward-looking statements. In addition, any statements that refer to projections of our future financial performance, our
anticipated growth and trends in our businesses, and other characterizations of future events or circumstances are forward-looking
statements. Readers are cautioned that these forward-looking statements are only predictions and are subject to risks,
uncertainties, and assumptions that are difficult to predict, including those identified below, as well as on the inside back cover of
this Annual Report to Shareholders and under “Part I, Item 1A. Risk Factors,” and elsewhere in our 2010 Annual Report on
Form 10-K. Therefore, actual results may differ materially and adversely from those expressed in any forward-looking statements.
We undertake no obligation to revise or update any forward-looking statements for any reason.
Overview
We design, manufacture, and sell Internet Protocol (IP)-based networking and other products related to the communications and
information technology (IT) industry and provide services associated with these products and their use. Our products and services
are designed to address a wide range of customers’ needs, including improving productivity, reducing costs, and gaining a
competitive advantage. In addition, our products and services are designed to help customers build their own network
infrastructures that support tools and applications that allow them to communicate with key stakeholders, including customers,
prospects, business partners, suppliers, and employees. We focus on delivering networking products and solutions that are
designed to simplify and secure customers’ network infrastructures. We believe that integrating multiple network services into our
products helps our customers reduce their total cost of network ownership. Our product offerings fall into the following categories:
our core technologies, routing and switching; advanced technologies; and other products. In addition to our product offerings, we
provide a broad range of service offerings, including technical support services and advanced services. Our customer base spans
virtually all types of public and private agencies and businesses, comprising: enterprise businesses (including public sector
entities), service providers, commercial customers, and consumers.
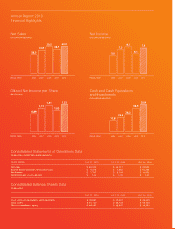
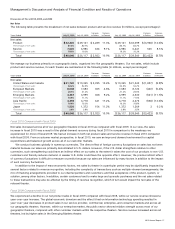
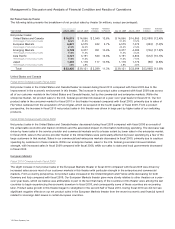
A summary of our results is as follows (in millions, except percentages and per-share amounts):
Fiscal 2010 Fiscal 2009 Variance
Net sales $ 40,040 $ 36,117 10.9%
Gross margin percentage 64.0% 63.9% 0.1%
Net income $ 7,767 $ 6,134 26.6%
Earnings per share—diluted $ 1.33 $ 1.05 26.7%
For fiscal 2010 our results reflected a return to a more balanced growth across each of our geographic theaters, product categories
and customer markets. Net sales totaled approximately $40.0 billion for fiscal 2010, an increase of approximately 11% compared
with fiscal 2009. Net income and net income per diluted share each increased by approximately 27% in fiscal 2010 compared with
fiscal 2009 primarily as a result of the increase in sales. The increase in net income for fiscal 2010 also benefited from a small
increase in the gross margin percentage, lower operating expenses as a percentage of revenue and a lower effective tax rate.
Additionally, our operating results for fiscal 2010 contain an extra week compared with fiscal 2009.
Strategy and Focus Areas
Our strategy centers on the network as the platform. Consistent with our strategy both during the fiscal 2009 economic downturn
and emerging from the downturn during fiscal 2010, we continue to seek to expand our share of our customers’ information
technology spending. We will endeavor to achieve this objective by focusing on our core networking capabilities while continuing to
expand into product markets in which the role of the network as the platform is increasing and which are similar, related, or
adjacent to markets in which we currently are active, which product markets we refer to as market adjacencies. We have continued
our focus on our core networking capabilities and have expanded our movement into market adjacencies, primarily through the
realignment of resources, while simultaneously reducing our operating expenses as a percentage of revenue during fiscal 2010.
We refer to the evolutionary process by which adjacencies arise as market transitions. Market transitions on which we are
focusing primary attention include those related to the increased role of virtualization/the cloud, video, collaboration, and networked
Web 2.0 technologies. With regard to virtualization/the cloud, one example of a market in which a significant market transition is
8 Cisco Systems, Inc.