Cisco 2010 Annual Report Download - page 44
Download and view the complete annual report
Please find page 44 of the 2010 Cisco annual report below. You can navigate through the pages in the report by either clicking on the pages listed below, or by using the keyword search tool below to find specific information within the annual report.-
 1
1 -
2
-
3
-
4
-
5
-
6
-
7
-
8
-
9
-
10
-
11
-
12
-
13
-
14
-
15
-
16
-
17
-
18
-
19
-
20
-
21
-
22
-
23
-
24
-
25
-
26
-
27
-
28
-
29
-
30
-
31
-
32
-
33
-
 34
34 -
 35
35 -
 36
36 -
 37
37 -
 38
38 -
 39
39 -
 40
40 -
 41
41 -
 42
42 -
 43
43 -
 44
44 -
 45
45 -
 46
46 -
 47
47 -
 48
48 -
 49
49 -
 50
50 -
 51
51 -
 52
52 -
 53
53 -
 54
54 -
55
-
56
-
57
-
58
-
59
-
60
-
61
-
62
-
63
-
64
-
65
-
66
-
67
-
68
-
69
-
70
-
71
-
72
-
73
-
74
-
75
-
76
-
77
-
78
-
79
-
80
-
81
-
82
-
83
-
84
 |
 |

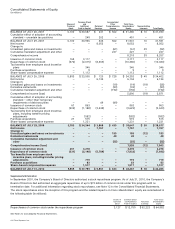
Consolidated Statements of Equity
(in millions)
Shares of
Common
Stock
Common Stock
and
Additional
Paid-In Capital
Retained
Earnings
Accumulated
Other
Comprehensive
Income
Total Cisco
Shareholders’
Equity
Noncontrolling
Interests Total Equity
BALANCE AT JULY 28, 2007 6,100 $ 30,687 $ 231 $ 562 $ 31,480 $ 10 $ 31,490
Cumulative effect of adoption of accounting
standard — uncertain tax positions — 249 202 — 451 — 451
BALANCE AT JULY 29, 2007 6,100 30,936 433 562 31,931 10 31,941
Net income — — 8,052 — 8,052 — 8,052
Change in:
Unrealized gains and losses on investments — — — (61) (61) 39 (22)
Cumulative translation adjustment and other — — — 227 227 — 227
Comprehensive income 8,218 39 8,257
Issuance of common stock 165 3,117 — — 3,117 — 3,117
Repurchase of common stock (372) (2,015) (8,365) — (10,380) — (10,380)
Tax benefits from employee stock incentive
plans — 346 — — 346 — 346
Purchase acquisitions — 9 — — 9 — 9
Share-based compensation expense — 1,112 — — 1,112 — 1,112
BALANCE AT JULY 26, 2008 5,893 $ 33,505 $ 120 $ 728 $ 34,353 $ 49 $ 34,402
Net income — — 6,134 — 6,134 — 6,134
Change in:
Unrealized gains and losses on investments — — — (19) (19) (19) (38)
Derivative instruments — — — (33) (33) — (33)
Cumulative translation adjustment and other — — — (192) (192) — (192)
Comprehensive income (loss) 5,890 (19) 5,871
Cumulative effect of adoption of accounting
standard — other-than-temporary
impairments of debt securities — — 49 (49) — — —
Issuance of common stock 67 863 — — 863 — 863
Repurchase of common stock (202) (1,188) (2,435) — (3,623) — (3,623)
Tax benefits from employee stock incentive
plans,including transfer pricing
adjustments — (582) — — (582) — (582)
Purchase acquisitions 27 515 — — 515 — 515
Share-based compensation expense — 1,231 — — 1,231 — 1,231
BALANCE AT JULY 25, 2009 5,785 $ 34,344 $ 3,868 $ 435 $ 38,647 $ 30 $ 38,677
Net income — — 7,767 — 7,767 — 7,767
Change in:
Unrealized gains and losses on investments — — — 195 195 (12) 183
Derivative instruments — — — 48 48 — 48
Cumulative translation adjustment and
other — — — (55) (55) — (55)
Comprehensive income (loss) 7,955 (12) 7,943
Issuance of common stock 201 3,278 — — 3,278 — 3,278
Repurchase of common stock (331) (2,148) (5,784) — (7,932) — (7,932)
Tax benefits from employee stock
incentive plans, including transfer pricing
adjustments — 719 — — 719 — 719
Purchase acquisitions — 83 — — 83 — 83
Share-based compensation expense — 1,517 — — 1,517 — 1,517
BALANCE AT JULY 31, 2010 5,655 $ 37,793 $ 5,851 $ 623 $ 44,267 $ 18 $ 44,285
Supplemental Information
In September 2001, the Company’s Board of Directors authorized a stock repurchase program. As of July 31, 2010, the Company’s
Board of Directors had authorized an aggregate repurchase of up to $72 billion of common stock under this program with no
termination date. For additional information regarding stock repurchases, see Note 12 to the Consolidated Financial Statements.
The stock repurchases since the inception of this program and the related impacts on Cisco shareholders’ equity are summarized in
the following table (in millions):
Shares of
Common
Stock
Common Stock
and Additional
Paid-In Capital
Retained
Earnings
Total Cisco
Shareholders’
Equity
Repurchases of common stock under the repurchase program 3,127 $ 12,759 $ 52,223 $ 64,982
See Notes to Consolidated Financial Statements.
42 Cisco Systems, Inc.