Cisco 2010 Annual Report Download - page 53
Download and view the complete annual report
Please find page 53 of the 2010 Cisco annual report below. You can navigate through the pages in the report by either clicking on the pages listed below, or by using the keyword search tool below to find specific information within the annual report.-
 1
1 -
2
-
3
-
4
-
5
-
6
-
7
-
8
-
9
-
10
-
11
-
12
-
13
-
14
-
15
-
16
-
17
-
18
-
19
-
20
-
21
-
22
-
23
-
24
-
25
-
26
-
27
-
28
-
29
-
30
-
31
-
32
-
33
-
34
-
35
-
36
-
37
-
38
-
39
-
40
-
41
-
42
-
 43
43 -
 44
44 -
 45
45 -
 46
46 -
 47
47 -
 48
48 -
 49
49 -
 50
50 -
 51
51 -
 52
52 -
 53
53 -
 54
54 -
 55
55 -
 56
56 -
 57
57 -
 58
58 -
 59
59 -
 60
60 -
 61
61 -
 62
62 -
 63
63 -
64
-
65
-
66
-
67
-
68
-
69
-
70
-
71
-
72
-
73
-
74
-
75
-
76
-
77
-
78
-
79
-
80
-
81
-
82
-
83
-
84
 |
 |

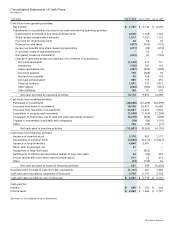
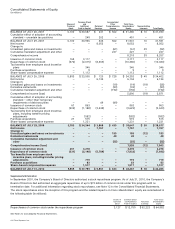
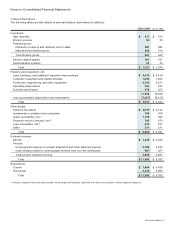
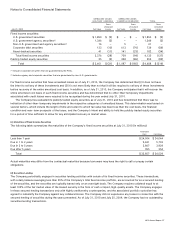
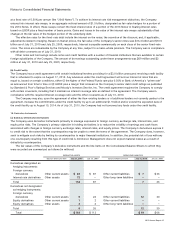
Notes to Consolidated Financial Statements
4. Goodwill and Purchased Intangible Assets
(a) Goodwill
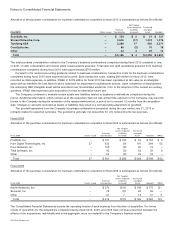
The following tables present the goodwill allocated to the Company’s reportable segments as of July 31, 2010 and July 25, 2009
and the changes to goodwill during fiscal 2010 and 2009 (in millions):
Balance at
July 25, 2009 Acquisitions Other
Balance at
July 31, 2010
United States and Canada $ 9,512 $ 1,802 $ (25) $ 11,289
European Markets 1,669 1,089 (29) 2,729
Emerging Markets 437 324 1 762
Asia Pacific 506 473 — 979
Japan 801 114 — 915
Total $ 12,925 $ 3,802 $ (53) $ 16,674
Balance at
July 26, 2008 Acquisitions Other
Balance at
July 25, 2009
United States and Canada $ 9,059 $ 467 $ (14) $ 9,512
European Markets 1,650 65 (46) 1,669
Emerging Markets 405 37 (5) 437
Asia Pacific 479 27 — 506
Japan 799 2 — 801
Total $ 12,392 $ 598 $ (65) $ 12,925
In the preceding tables, “Other” primarily includes foreign currency translation and purchase accounting adjustments.
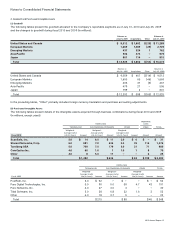
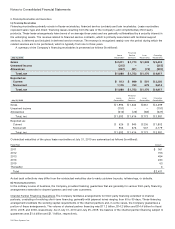
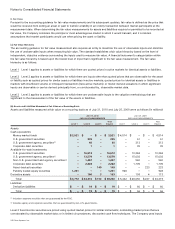
(b) Purchased Intangible Assets
The following tables present details of the intangible assets acquired through business combinations during fiscal 2010 and 2009
(in millions, except years):
FINITE LIVES
INDEFINITE
LIVES
TECHNOLOGY CUSTOMER RELATIONSHIPS OTHER IPR&D TOTAL
Weighted-
Average Useful
Life (in Years) Amount
Weighted-
Average Useful
Life (in Years) Amount
Weighted-
Average Useful
Life (in Years) Amount Amount AmountFiscal 2010
ScanSafe, Inc. 5.0 $ 14 6.0 $ 11 3.0 $ 6 $ — $ 31
Starent Networks, Corp. 6.0 691 7.0 434 0.3 35 114 1,274
Tandberg ASA 5.0 709 7.0 179 3.0 21 71 980
CoreOptics Inc. 4.0 60 1.0 1 1.0 1 8 70
Other 4.0 8 5.0 11 — — 6 25
Total $ 1,482 $ 636 $ 63 $ 199 $ 2,380
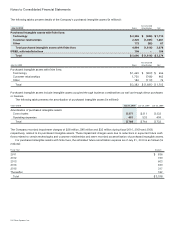
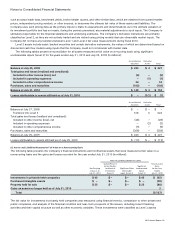
FINITE LIVES
TECHNOLOGY CUSTOMER RELATIONSHIPS OTHER TOTAL
Fiscal 2009
Weighted-
Average Useful
Life (in Years) Amount
Weighted-
Average Useful
Life (in Years) Amount
Weighted-
Average Useful
Life (in Years) Amount Amount
PostPath, Inc. 6.0 $ 52 — $ — — $ — $ 52
Pure Digital Technologies, Inc. 5.0 90 5.0 58 4.7 43 191
Pure Networks, Inc. 4.0 27 3.0 3 — — 30
Tidal Software, Inc. 5.0 28 6.8 22 1.6 2 52
Other 6.0 18 3.7 5 — — 23
Total $ 215 $ 88 $ 45 $ 348
2010 Annual Report 51