3M 2014 Annual Report Download - page 95
Download and view the complete annual report
Please find page 95 of the 2014 3M annual report below. You can navigate through the pages in the report by either clicking on the pages listed below, or by using the keyword search tool below to find specific information within the annual report.-
 1
1 -
2
-
3
-
4
-
5
-
6
-
7
-
8
-
9
-
10
-
11
-
12
-
13
-
14
-
15
-
16
-
17
-
18
-
19
-
20
-
21
-
22
-
23
-
24
-
25
-
26
-
27
-
28
-
29
-
30
-
31
-
32
-
33
-
34
-
35
-
36
-
37
-
38
-
39
-
40
-
41
-
42
-
43
-
44
-
45
-
46
-
47
-
48
-
49
-
50
-
51
-
52
-
53
-
54
-
55
-
56
-
57
-
58
-
59
-
60
-
61
-
62
-
63
-
64
-
65
-
66
-
67
-
68
-
69
-
70
-
71
-
72
-
73
-
74
-
75
-
76
-
77
-
78
-
79
-
80
-
81
-
82
-
83
-
84
-
 85
85 -
 86
86 -
 87
87 -
 88
88 -
 89
89 -
 90
90 -
 91
91 -
 92
92 -
 93
93 -
 94
94 -
 95
95 -
 96
96 -
 97
97 -
 98
98 -
 99
99 -
 100
100 -
 101
101 -
 102
102 -
 103
103 -
 104
104 -
 105
105 -
106
-
107
-
108
-
109
-
110
-
111
-
112
-
113
-
114
-
115
-
116
-
117
-
118
-
119
-
120
-
121
-
122
-
123
-
124
-
125
-
126
-
127
-
128
-
129
-
130
-
131
-
132
 |
 |

89
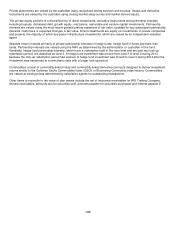
services and sources. Swaps and derivative instruments are valued by the custodian using market swap curves and
market derived inputs.
The private equity portfolio is a diversified mix of direct investments, derivative instruments and partnership interests
including buyouts, distressed debt, growth equity, mezzanine, real estate and venture capital investments. Partnership
interests are valued using the most recent general partner statement of fair value, updated for any subsequent partnership
interests’ cash flows or expected changes in fair value. Direct investments are equity co-investments in private companies
and projects, the majority of which are power infrastructure investments, which are valued by an independent valuation
agent.
Absolute return primarily consists of private partnership interests in hedge funds, hedge fund of funds and bank loan
funds. Partnership interests are valued using the NAV as determined by the independent administrator or custodian of the
fund. Generally, hedge fund partnership interests, which have a redemption right in the near term and are past any lock-
up redemption period, are classified as level 2. In 2014, a hedge fund investment was moved to level 3 after the
investment was transferred to a new share class with a longer lock-up period. Another hedge fund was moved from level
3 to level 2 during 2014 because the lock-up redemption period had expired. The hedge fund level changes net to zero in
the table below.
Commodities consist of commodity-linked notes and commodity-linked derivative contracts designed to deliver investment
returns similar to the GSCI or Bloomberg Commodity index returns. Commodities are valued at closing prices determined
by calculation agents for outstanding transactions.
Other items to reconcile to fair value of plan assets include the net of interest receivables, amounts due for securities sold,
foreign currency fluctuations, amounts payable for securities purchased and interest payable.
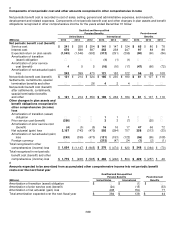
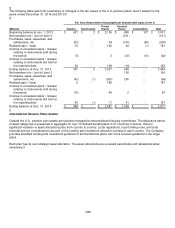
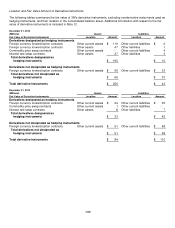
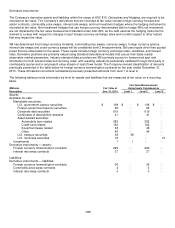
The following table sets forth a summary of changes in the fair values of the postretirement plans’ level 3 assets for the
years ended December 31, 2014 and 2013:
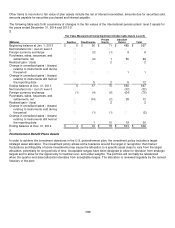
Fair Value Measurement Using Significant Unobservable Inputs (Level 3)
Equities
Fixed Income
Private
Equity
Absolute
Return
Commodities
Total (Millions)
Beginning balance at Jan. 1, 2013
$
16 $ ―
$
170 $ 28
$
4
$
218
Net transfers into / (out of) level 3
― ― ― ― ― ―
Purchases, sales, issuances, and
settlements, net
(3) ― (27) (4) (4) (38)
Realized gain / (loss)
― ― 10 2 ― 12
Change in unrealized gains / (losses)
relating to instruments sold during
the period
― ― (3) (1) ― (4)
Change in unrealized gains / (losses)
relating to instruments still held at
the reporting date
3 ― 11 1 ― 15
Ending balance at Dec. 31, 2013
16 ― 161 26 ― 203
Net transfers into / (out of) level 3
(2) ― ― ― ― (2)
Purchases, sales, issuances, and
settlements, net
(2) ― (45) 8 ― (39)
Realized gain / (loss)
― ― 29 ― ― 29
Change in unrealized gains / (losses)
relating to instruments sold during
the period
― ― (5) ― ― (5)
Change in unrealized gains / (losses)
relating to instruments still held at
the reporting date
2 ― 19 3 ― 24
Ending balance at Dec. 31, 2014
$
14 $ ―
$
159 $ 37
$
―
$
210