3M 2014 Annual Report Download - page 25
Download and view the complete annual report
Please find page 25 of the 2014 3M annual report below. You can navigate through the pages in the report by either clicking on the pages listed below, or by using the keyword search tool below to find specific information within the annual report.-
 1
1 -
2
-
3
-
4
-
5
-
6
-
7
-
8
-
9
-
10
-
11
-
12
-
13
-
14
-
 15
15 -
 16
16 -
 17
17 -
 18
18 -
 19
19 -
 20
20 -
 21
21 -
 22
22 -
 23
23 -
 24
24 -
 25
25 -
 26
26 -
 27
27 -
 28
28 -
 29
29 -
 30
30 -
 31
31 -
 32
32 -
 33
33 -
 34
34 -
 35
35 -
36
-
37
-
38
-
39
-
40
-
41
-
42
-
43
-
44
-
45
-
46
-
47
-
48
-
49
-
50
-
51
-
52
-
53
-
54
-
55
-
56
-
57
-
58
-
59
-
60
-
61
-
62
-
63
-
64
-
65
-
66
-
67
-
68
-
69
-
70
-
71
-
72
-
73
-
74
-
75
-
76
-
77
-
78
-
79
-
80
-
81
-
82
-
83
-
84
-
85
-
86
-
87
-
88
-
89
-
90
-
91
-
92
-
93
-
94
-
95
-
96
-
97
-
98
-
99
-
100
-
101
-
102
-
103
-
104
-
105
-
106
-
107
-
108
-
109
-
110
-
111
-
112
-
113
-
114
-
115
-
116
-
117
-
118
-
119
-
120
-
121
-
122
-
123
-
124
-
125
-
126
-
127
-
128
-
129
-
130
-
131
-
132
 |
 |

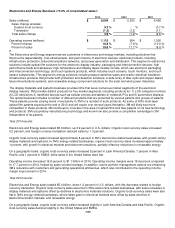
19
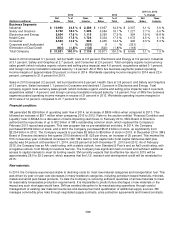
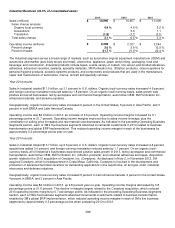
2014 vs. 2013
2014
2013
% change
Net
% of Oper.
Net
% of Oper.
Net Oper.
(Dollars in millions)
Sales
Total Income
Sales
Total Income
Sales Income
Business Segments
Industrial
$
10,990
34.5
%
$
2,389
$
10,657
34.5
%
$
2,307
3.1 %
3.6
%
Safety and Graphics
5,732
18.0
%
1,296
5,584
18.1
%
1,227
2.7 %
5.6
%
Electronics and Energy
5,604
17.6
%
1,115
5,393
17.5
%
954
3.9 %
16.8
%
Health Care
5,572
17.5
%
1,72
4
5,334
17.3
%
1,672
4.5 %
3.1
%
Consumer
4,523
14.2
%
995
4,435
14.4
%
945
2.0 %
5.3
%
Corporate and Unallocated
4
―
%
(251)
8
―
%
(321)
― ―
Elimination of Dual Credit
(604)
(1.8)
%
(133)
(540)
(1.8)
%
(118)
― ―
Total Company
$
31,821
100.0
%
$
7,135
$
30,871
100.0
%
$
6,666
3.1 %
7.0
%
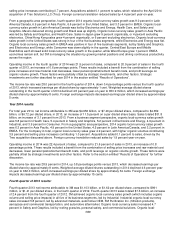
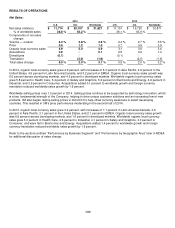
Sales in 2014 increased 3.1 percent, led by Health Care at 4.5 percent, Electronics and Energy at 3.9 percent, Industrial
at 3.1 percent, Safety and Graphics at 2.7 percent, and Consumer at 2.0 percent. Total company organic local-currency
sales growth (which includes organic volume and selling price impacts) was 4.9 percent, acquisitions added 0.1 percent,
and foreign currency translation reduced sales by 1.9 percent. All of 3M’s five business segments posted operating
income margins of approximately 20 percent or more in 2014. Worldwide operating income margins for 2014 were 22.4
percent, compared to 21.6 percent for 2013.
Sales in 2013 increased 3.2 percent, led by Industrial at 6.5 percent, Health Care at 3.8 percent, and Safety and Graphics
at 3.3 percent. Sales increased 1.1 percent in Consumer and declined 1.2 percent in Electronics and Energy. Total
company organic local-currency sales growth (which includes organic volume and selling price impacts) was 3.4 percent,
acquisitions added 1.4 percent, and foreign currency translation reduced sales by 1.6 percent. Four of 3M’s five business
segments posted operating income margins in excess of 21 percent in 2013. Worldwide operating income margins for
2013 were 21.6 percent, compared to 21.7 percent for 2012.
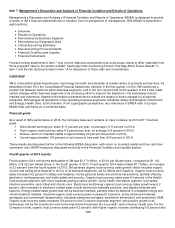
Financial condition:
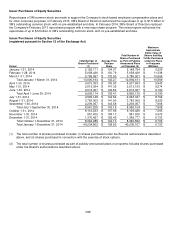
3M generated $6.626 billion of operating cash flow in 2014, an increase of $809 million when compared to 2013. This
followed an increase of $517 million when comparing 2013 to 2012. Refer to the section entitled “Financial Condition and
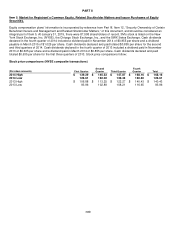
Liquidity” later in MD&A for a discussion of items impacting cash flows. In February 2014, 3M’s Board of Directors
authorized the repurchase of up to $12 billion of 3M’s outstanding common stock, which replaced the Company’s
February 2013 repurchase program. This new program has no pre-established end date. In 2014, the Company
purchased $5.652 billion of stock, and in 2013 the Company purchased $5.212 billion of stock, up significantly from
$2.204 billion in 2012. The Company expects to purchase $3 billion to $5 billion of stock in 2015. In December 2014, 3M’s
Board of Directors declared a first-quarter 2015 dividend of $1.025 per share, an increase of 20 percent. This marked the
57th consecutive year of dividend increases for 3M. 3M’s debt to total capital ratio (total capital defined as debt plus
equity) was 34 percent at December 31, 2014, and 25 percent at both December 31, 2013 and 2012. As of February
2015, the Company has an AA- credit rating, with a stable outlook, from Standard & Poor's and an Aa3 credit rating, with
a negative outlook, from Moody's Investors Service. The Company has significant cash on hand and sufficient additional
access to capital markets to meet its funding needs. 3M currently expects that its effective tax rate for 2015 will be
approximately 28.0 to 29.0 percent, which assumes that the U.S. research and development credit will be reinstated for
2015.
Raw materials:
In 2014, the Company experienced stable to declining costs for most raw material categories and transportation fuel. This
was driven by year-on-year cost decreases in many feedstock categories, including petroleum based materials, minerals,
metals and wood pulp based products. To date the Company is receiving sufficient quantities of all raw materials to meet
its reasonably foreseeable production requirements. It is impossible to predict future shortages of raw materials or the
impact any such shortages would have. 3M has avoided disruption to its manufacturing operations through careful
management of existing raw material inventories and development and qualification of additional supply sources. 3M
manages commodity price risks through negotiated supply contracts, price protection agreements and forward contracts.