3M 2014 Annual Report Download - page 3
Download and view the complete annual report
Please find page 3 of the 2014 3M annual report below. You can navigate through the pages in the report by either clicking on the pages listed below, or by using the keyword search tool below to find specific information within the annual report.-
 1
1 -
 2
2 -
 3
3 -
 4
4 -
 5
5 -
 6
6 -
 7
7 -
 8
8 -
 9
9 -
 10
10 -
 11
11 -
 12
12 -
 13
13 -
 14
14 -
15
-
16
-
17
-
18
-
19
-
20
-
21
-
22
-
23
-
24
-
25
-
26
-
27
-
28
-
29
-
30
-
31
-
32
-
33
-
34
-
35
-
36
-
37
-
38
-
39
-
40
-
41
-
42
-
43
-
44
-
45
-
46
-
47
-
48
-
49
-
50
-
51
-
52
-
53
-
54
-
55
-
56
-
57
-
58
-
59
-
60
-
61
-
62
-
63
-
64
-
65
-
66
-
67
-
68
-
69
-
70
-
71
-
72
-
73
-
74
-
75
-
76
-
77
-
78
-
79
-
80
-
81
-
82
-
83
-
84
-
85
-
86
-
87
-
88
-
89
-
90
-
91
-
92
-
93
-
94
-
95
-
96
-
97
-
98
-
99
-
100
-
101
-
102
-
103
-
104
-
105
-
106
-
107
-
108
-
109
-
110
-
111
-
112
-
113
-
114
-
115
-
116
-
117
-
118
-
119
-
120
-
121
-
122
-
123
-
124
-
125
-
126
-
127
-
128
-
129
-
130
-
131
-
132
 |
 |
To our
shareholders
1
Annual Report 2014
2014 was a year of strong and broad-based results for our company. For the full year –
as well as in each individual quarter – we delivered organic growth in all business groups
and across all geographic areas. We posted record sales and earnings-per-share, while
returning record cash to shareholders. We also continued to make investments in the
business to position us for long-term success.
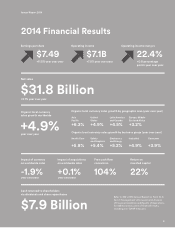
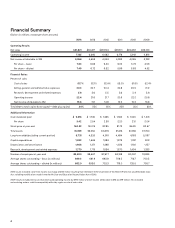
Sales for the year were $32 billion, an all-time high. Earnings-per-share rose to $7.49.
We expanded operating income to more than $7 billion, and operating margins to 22.4
percent. We returned $7.9 billion to shareholders through dividends and repurchases.
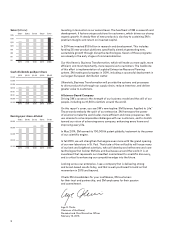
We also made good progress on our ve-year nancial objectives, which I laid out
in November 2012, covering the period from 2013-2017:
• Our earnings-per-share growth target is 9 to 11 percent per year, on average;
in 2014, earnings-per-share grew 11.5 percent.
• Our organic growth target is 4 to 6 percent per year, on average;
in 2014, we grew 4.9 percent organically.
• Our target for Return on Invested Capital is approximately 20 percent;
in 2014, we achieved 22 percent.
• Our Free Cash Flow Conversion target is approximately 100 percent;
in 2014, we hit 104 percent.
Our strong free cash ow capability and performance continue to give us the
condence and exibility to increase returns to shareholders. It also allows us to
continue investing in our future, including through our three strategic levers.
Strategic Levers Power Us Forward
In last year’s letter, I highlighted 3M’s three strategic levers: Portfolio Management,
Investing in Innovation and Business Transformation. In 2014, those levers continued to
not only drive results today, but also strengthen our foundation for long-term prosperity.
The rst lever is Portfolio Management. Core to 3M is our culture of continuous
improvement, which includes actively managing and enhancing our portfolio. Since
2012, for example, we’ve realigned from six sectors to ve business groups, and
from 40 businesses to 27. In 2014 alone, we combined businesses within three of our
business groups to increase customer relevance, build scale and drive eciencies.
Mergers and Acquisitions are another piece of portfolio management. Last year we
invested $1 billion in acquisitions, including acquiring the remaining 25 percent of our
Sumitomo subsidiary. 3M now has full control of one of our largest and most successful
subsidiaries, and we look forward to growing that business even further into the future.