3M 2014 Annual Report Download - page 28
Download and view the complete annual report
Please find page 28 of the 2014 3M annual report below. You can navigate through the pages in the report by either clicking on the pages listed below, or by using the keyword search tool below to find specific information within the annual report.-
 1
1 -
2
-
3
-
4
-
5
-
6
-
7
-
8
-
9
-
10
-
11
-
12
-
13
-
14
-
15
-
16
-
17
-
 18
18 -
 19
19 -
 20
20 -
 21
21 -
 22
22 -
 23
23 -
 24
24 -
 25
25 -
 26
26 -
 27
27 -
 28
28 -
 29
29 -
 30
30 -
 31
31 -
 32
32 -
 33
33 -
 34
34 -
 35
35 -
 36
36 -
 37
37 -
 38
38 -
39
-
40
-
41
-
42
-
43
-
44
-
45
-
46
-
47
-
48
-
49
-
50
-
51
-
52
-
53
-
54
-
55
-
56
-
57
-
58
-
59
-
60
-
61
-
62
-
63
-
64
-
65
-
66
-
67
-
68
-
69
-
70
-
71
-
72
-
73
-
74
-
75
-
76
-
77
-
78
-
79
-
80
-
81
-
82
-
83
-
84
-
85
-
86
-
87
-
88
-
89
-
90
-
91
-
92
-
93
-
94
-
95
-
96
-
97
-
98
-
99
-
100
-
101
-
102
-
103
-
104
-
105
-
106
-
107
-
108
-
109
-
110
-
111
-
112
-
113
-
114
-
115
-
116
-
117
-
118
-
119
-
120
-
121
-
122
-
123
-
124
-
125
-
126
-
127
-
128
-
129
-
130
-
131
-
132
 |
 |

22
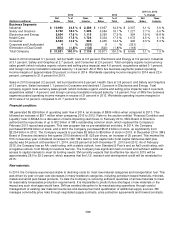
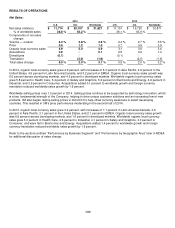
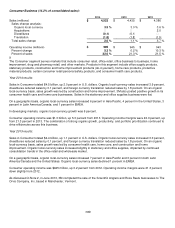
Operating Expenses:
2014 Versus
2013
2013 Versus
2012
(Percent of net sales)
2014 2013 2012
Cost of sales
51.7
%
52.1 %
52.4
%
(0.4)%
(0.3)
%
Selling, general and administrative 20.3
20.7 20.4
(0.4) 0.3
expenses
Research, development and related 5.6
5.6 5.5
― 0.1
expenses
Operating income
22.4
%
21.6 %
21.7
%
0.8 %
(0.1)
%
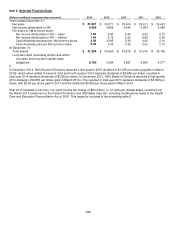
Pension and postretirement expense decreased $162 million in 2014 compared to 2013, versus a decrease of $97 million
in 2013 compared to 2012. 2012 includes a $26 million charge related to the first-quarter 2012 voluntary early retirement
incentive program (discussed in Note 10). Pension and postretirement expense is recorded in cost of sales; selling,
general and administrative expenses (SG&A); and research, development and related expenses (R&D). Refer to Note 10
(Pension and Postretirement Plans) for components of net periodic benefit cost and the assumptions used to determine
net cost.
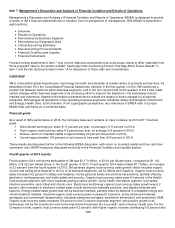
The Company is investing in business transformation. This term includes the ongoing multi-year phased implementation
of an enterprise resource planning (ERP) system on a worldwide basis, as well as changes in processes and
internal/external service delivery across 3M.
Cost of Sales:
Cost of sales includes manufacturing, engineering and freight costs.
Cost of sales, measured as a percent of net sales, was 51.7 percent in 2014, a decrease of 0.4 percentage points from
2013. Cost of sales as a percent of sales decreased due to the combination of selling price increases and raw material
cost decreases, as selling prices increased net sales by 1.0 percent and raw material cost deflation was favorable by
approximately 1.5 percent year-on-year. In addition, lower pension and postretirement costs (of which a portion impacts
cost of sales), along with organic volume leverage, decreased cost of sales as a percent of sales.
Cost of sales, measured as a percent of net sales, was 52.1 percent in 2013, a decrease of 0.3 percentage points from
2012. Cost of sales as a percent of sales decreased due to the combination of selling price increases and raw material
cost decreases, as selling prices increased net sales by 0.9 percent and raw material cost deflation was favorable by
approximately 2 percent year-on-year. In addition, lower pension and postretirement costs (of which a portion impacts
cost of sales), in addition to organic volume increases, decreased cost of sales as a percent of sales. These benefits were
partially offset by the impact of 2012 acquisitions and lower factory utilization.
Selling, General and Administrative Expenses:
Selling, general and administrative expenses (SG&A) increased $85 million, or 1.3 percent, in 2014 when compared to
2013. Year 2014 included strategic investments in business transformation, while lower pension and postretirement
expense benefitted SG&A. SG&A, measured as a percent of sales, decreased 0.4 percentage points to 20.3 percent in
2014, compared to 20.7 percent of sales in 2013.
SG&A increased $282 million, or 4.6 percent, in 2013 when compared to 2012. In 2013, SG&A included strategic
investments in business transformation, in addition to increases from acquired businesses that were largely not in 3M’s
2012 spending (Ceradyne, Inc. and Federal Signal Technologies), which were partially offset by lower pension and
postretirement expense. SG&A, measured as a percent of sales, increased 0.3 percentage points to 20.7 percent in 2013,
compared to 20.4 percent of sales in 2012.
Research, Development and Related Expenses:
Research, development and related expenses (R&D) increased 3.2 percent in 2014 compared to 2013 and increased 4.9
percent in 2013 compared to 2012, as 3M continued to support its key growth initiatives, including more R&D aimed at
disruptive innovation, which refers to innovation which has the potential to create new markets and disrupt existing
markets. These increases were partially offset by lower pension and postretirement expense. In 2013, increases from
acquired businesses that were largely not in 3M’s 2012 spending (primarily Ceradyne, Inc. and Federal Signal