3M 2014 Annual Report Download - page 122
Download and view the complete annual report
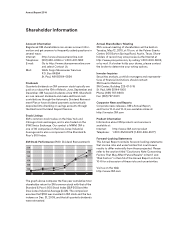
Please find page 122 of the 2014 3M annual report below. You can navigate through the pages in the report by either clicking on the pages listed below, or by using the keyword search tool below to find specific information within the annual report.-
 1
1 -
2
-
3
-
4
-
5
-
6
-
7
-
8
-
9
-
10
-
11
-
12
-
13
-
14
-
15
-
16
-
17
-
18
-
19
-
20
-
21
-
22
-
23
-
24
-
25
-
26
-
27
-
28
-
29
-
30
-
31
-
32
-
33
-
34
-
35
-
36
-
37
-
38
-
39
-
40
-
41
-
42
-
43
-
44
-
45
-
46
-
47
-
48
-
49
-
50
-
51
-
52
-
53
-
54
-
55
-
56
-
57
-
58
-
59
-
60
-
61
-
62
-
63
-
64
-
65
-
66
-
67
-
68
-
69
-
70
-
71
-
72
-
73
-
74
-
75
-
76
-
77
-
78
-
79
-
80
-
81
-
82
-
83
-
84
-
85
-
86
-
87
-
88
-
89
-
90
-
91
-
92
-
93
-
94
-
95
-
96
-
97
-
98
-
99
-
100
-
101
-
102
-
103
-
104
-
105
-
106
-
107
-
108
-
109
-
110
-
111
-
 112
112 -
 113
113 -
 114
114 -
 115
115 -
 116
116 -
 117
117 -
 118
118 -
 119
119 -
 120
120 -
 121
121 -
 122
122 -
 123
123 -
 124
124 -
 125
125 -
 126
126 -
 127
127 -
 128
128 -
 129
129 -
 130
130 -
 131
131 -
 132
132
 |
 |

116
Business
Segment
Product
s
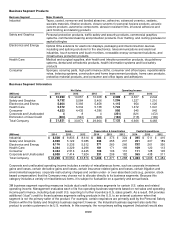
Business Segment
Major Products
Industrial
Tapes, coated, nonwoven and bonded abrasives, adhesives, advanced ceramics, sealants,
specialty materials, filtration products, closure systems for personal hygiene products, acoustic
systems products, automotive components, abrasion-resistant films, structural adhesives and
paint finishing and detailing products
Safety and Graphics Personal protection products, traffic safety and security products, commercial graphics
systems, c
ommercial cleaning and protection products, floor matting, and roofing granules for
asphalt shingles
Electronics and Energy Optical films solutions for electronic displays, packaging and interconnection devices,
insulating and splicing solutions for the electronics, telecommunications and electrical
industries, touch screens and touch monitors, renewable energy component solutions, and
infrastructure protection products
Health Care Medical and surgical supplies, skin health and infection prevention products, drug delivery
systems, dental and orthodontic products, health information systems and food safety
products
Consumer Sponges, scouring pads, high-
performance cloths, consumer and office tapes, repositionable
no
tes, indexing systems, construction and home improvement products, home care products,
protective material products, and consumer and office tapes and adhesives
Business
Segment
Information
Net Sales
Operating Income
(Millions)
2014
2013
2012
2014
2013
2012
Industrial
$
10,990
$
10,657 $
10,008
$
2,389
$
2,307 $
2,244
Safety and Graphics
5,732
5,584 5,406
1,
296
1,227 1,210
Electronics and Energy
5,604
5,393 5,458
1,115
954 1,026
Health Care
5,572
5,334 5,138
1,724
1,672 1,641
Consumer
4,523
4,435 4,386
995
945 943
Corporate and Unallocated
4
8 4
(251)
(321) (472)
Elimination of Dual Credit
(604)
(540)
(496)
(133)
(118)
(109)
Total Company
$
31,821
$
30,871 $
29,904
$
7,135
$
6,666 $
6,483
Assets
Depreciation & Amortization
Capital Expenditures
(Millions)
2014
2013
2012
2014
2013
2012
2014
2013
2012
Industrial
$
8,508
$
8,833
$
8,614
$
383
$
373
$
324
$
395
$
511
$
416
Safety and Graphics
4,939
5,122
5,085
234
255
237
221
207
189
Electronics and Energy
5,116
5,336
5,512
271
260
266
232
261
350
Health Care
4,344
4,329
4,296
181
171
169
169
120
113
Consumer
2,434
2,516
2,445
108
106
110
111
128
105
Corporate and Unallocated
5,928
7,414
7,924
231
206
182
365
438
311
Total Company
$
31,269
$
33,550
$
33,876
$
1,408
$
1,371
$
1,288
$
1,493
$
1,665
$
1,484
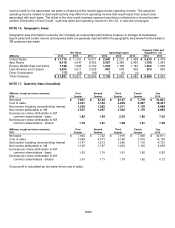
Corporate and unallocated operating income includes a variety of miscellaneous items, such as corporate investment
gains and losses, certain derivative gains and losses, certain insurance-related gains and losses, certain litigation and
environmental expenses, corporate restructuring charges and certain under- or over-absorbed costs (e.g. pension, stock-
based compensation) that the Company may choose not to allocate directly to its business segments. Because this
category includes a variety of miscellaneous items, it is subject to fluctuation on a quarterly and annual basis.
3M business segment reporting measures include dual credit to business segments for certain U.S. sales and related
operating income. Management evaluates each of its five operating business segments based on net sales and operating
income performance, including dual credit U.S. reporting to further incentivize U.S. sales growth. As a result, 3M provides
additional (“dual”) credit to those business segments selling products in the U.S. to an external customer when that
segment is not the primary seller of the product. For example, certain respirators are primarily sold by the Personal Safety
Division within the Safety and Graphics business segment; however, the Industrial business segment also sells this
product to certain customers in its U.S. markets. In this example, the non-primary selling segment (Industrial) would also