3M 2014 Annual Report Download - page 5
Download and view the complete annual report
Please find page 5 of the 2014 3M annual report below. You can navigate through the pages in the report by either clicking on the pages listed below, or by using the keyword search tool below to find specific information within the annual report.-
 1
1 -
 2
2 -
 3
3 -
 4
4 -
 5
5 -
 6
6 -
 7
7 -
 8
8 -
 9
9 -
 10
10 -
 11
11 -
 12
12 -
 13
13 -
 14
14 -
 15
15 -
 16
16 -
17
-
18
-
19
-
20
-
21
-
22
-
23
-
24
-
25
-
26
-
27
-
28
-
29
-
30
-
31
-
32
-
33
-
34
-
35
-
36
-
37
-
38
-
39
-
40
-
41
-
42
-
43
-
44
-
45
-
46
-
47
-
48
-
49
-
50
-
51
-
52
-
53
-
54
-
55
-
56
-
57
-
58
-
59
-
60
-
61
-
62
-
63
-
64
-
65
-
66
-
67
-
68
-
69
-
70
-
71
-
72
-
73
-
74
-
75
-
76
-
77
-
78
-
79
-
80
-
81
-
82
-
83
-
84
-
85
-
86
-
87
-
88
-
89
-
90
-
91
-
92
-
93
-
94
-
95
-
96
-
97
-
98
-
99
-
100
-
101
-
102
-
103
-
104
-
105
-
106
-
107
-
108
-
109
-
110
-
111
-
112
-
113
-
114
-
115
-
116
-
117
-
118
-
119
-
120
-
121
-
122
-
123
-
124
-
125
-
126
-
127
-
128
-
129
-
130
-
131
-
132
 |
 |

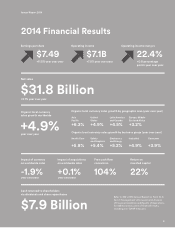
2014 Financial Results
Earnings per share Operating income
$7.49
+11.5% year over year
+3.1% year over year
year over year
year over year year over year
22.4%
Organic local currency
sales growth worldwide
Organic local currency sales growth by geographic area (year over year)
Organic local currency sales growth by business group (year over year)
Latin America
and Canada
+4.5%
Electronics
and Energy
+5.2%
Asia
Pacic
+6.3%
Health Care
+5.8%
Europe, Middle
East and Africa
+3.2%
Industrial
+4.9%
Consumer
+3.9%
Operating income margins
Net sales
$31.8 Billion
Impact of currency
on worldwide sales
Free cash ow
conversion
Cash returned to shareholders
via dividends and share repurchases
Return on
invested capital
Impact of acquisitions
on worldwide sales
-1.9% 104% 22%+0.1%
$7.9 Billion
+4.9%
United
States
+4.9%
Safety
and Graphics
+5.4%
$7.1B
+7.0% year over year
Annual Report 2014
3
Refer to 3M’s 2014 Annual Report on Form 10-K,
Item 7, Management’s Discussion and Analysis
of Financial Condition and Results of Operations,
for additional discussion of nancial results,
including non-GAAP measures.
+0.8 percentage
points year over year