3M 2014 Annual Report Download - page 64
Download and view the complete annual report
Please find page 64 of the 2014 3M annual report below. You can navigate through the pages in the report by either clicking on the pages listed below, or by using the keyword search tool below to find specific information within the annual report.-
 1
1 -
2
-
3
-
4
-
5
-
6
-
7
-
8
-
9
-
10
-
11
-
12
-
13
-
14
-
15
-
16
-
17
-
18
-
19
-
20
-
21
-
22
-
23
-
24
-
25
-
26
-
27
-
28
-
29
-
30
-
31
-
32
-
33
-
34
-
35
-
36
-
37
-
38
-
39
-
40
-
41
-
42
-
43
-
44
-
45
-
46
-
47
-
48
-
49
-
50
-
51
-
52
-
53
-
 54
54 -
 55
55 -
 56
56 -
 57
57 -
 58
58 -
 59
59 -
 60
60 -
 61
61 -
 62
62 -
 63
63 -
 64
64 -
 65
65 -
 66
66 -
 67
67 -
 68
68 -
 69
69 -
 70
70 -
 71
71 -
 72
72 -
 73
73 -
 74
74 -
75
-
76
-
77
-
78
-
79
-
80
-
81
-
82
-
83
-
84
-
85
-
86
-
87
-
88
-
89
-
90
-
91
-
92
-
93
-
94
-
95
-
96
-
97
-
98
-
99
-
100
-
101
-
102
-
103
-
104
-
105
-
106
-
107
-
108
-
109
-
110
-
111
-
112
-
113
-
114
-
115
-
116
-
117
-
118
-
119
-
120
-
121
-
122
-
123
-
124
-
125
-
126
-
127
-
128
-
129
-
130
-
131
-
132
 |
 |

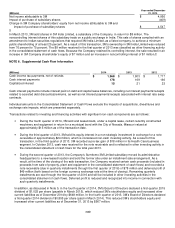
58
basic scientific research and the application of scientific advances in the development of new and improved products and
their uses, totaled $1.193 billion in 2014, $1.150 billion in 2013 and $1.079 billion in 2012. Related expenses primarily
include technical support provided by 3M to customers who are using existing 3M products; internally developed patent
costs, which include costs and fees incurred to prepare, file, secure and maintain patents; amortization of externally
acquired patents and externally acquired in-process research and development; and gains/losses associated with certain
corporate approved investments in R&D-related ventures, such as equity method effects and impairments.
Internal-use software: The Company capitalizes direct costs of services used in the development of internal-use software.
Amounts capitalized are amortized over a period of three to seven years, generally on a straight-line basis, unless another
systematic and rational basis is more representative of the software’s use. Amounts are reported as a component of either
machinery and equipment or capital leases within property, plant and equipment.
Environmental: Environmental expenditures relating to existing conditions caused by past operations that do not
contribute to current or future revenues are expensed. Reserves for liabilities related to anticipated remediation costs are
recorded on an undiscounted basis when they are probable and reasonably estimable, generally no later than the
completion of feasibility studies, the Company’s commitment to a plan of action, or approval by regulatory agencies.
Environmental expenditures for capital projects that contribute to current or future operations generally are capitalized and
depreciated over their estimated useful lives.
Income taxes: The provision for income taxes is determined using the asset and liability approach. Under this approach,
deferred income taxes represent the expected future tax consequences of temporary differences between the carrying
amounts and tax basis of assets and liabilities. The Company records a valuation allowance to reduce its deferred tax
assets when uncertainty regarding their realizability exists. As of December 31, 2014 and 2013, the Company had
valuation allowances of $22 million and $23 million on its deferred tax assets, respectively. The Company recognizes and
measures its uncertain tax positions based on the rules under ASC 740, Income Taxes.
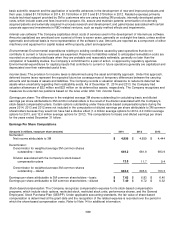
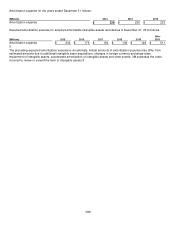
Earnings per share: The difference in the weighted average 3M shares outstanding for calculating basic and diluted
earnings per share attributable to 3M common shareholders is the result of the dilution associated with the Company’s
stock-based compensation plans. Certain options outstanding under these stock-based compensation plans during the
years 2014, 2013 and 2012 were not included in the computation of diluted earnings per share attributable to 3M common
shareholders because they would not have had a dilutive effect (1.4 million average options for 2014, 2.0 million average
options for 2013, and 12.6 million average options for 2012). The computations for basic and diluted earnings per share
for the years ended December 31 follow:
Earnings Per Share Computations
(Amounts in millions, except per share amounts)
2014
2013
2012
Numerator:
Net income attributable to 3M $
4,956 $
4,659 $
4,444
Denominator:
Denominator for weighted average 3M common shares
outstanding – basic
649.2
681.9 693.9
Dilution associated with the Company’s stock-based
compensation plans
12.8
11.7 9.4
Denominator for weighted average 3M common shares
outstanding – diluted
662.0
693.6 703.3
Earnings per share attributable to 3M common shareholders – basic
$
7.63
$
6.83 $
6.40
Earnings per share attributable to 3M common shareholders – diluted
$
7.49
$
6.72 $
6.32
Stock-based compensation: The Company recognizes compensation expense for its stock-based compensation
programs, which include stock options, restricted stock, restricted stock units, performance shares, and the General
Employees’ Stock Purchase Plan (GESPP). Under applicable accounting standards, the fair value of share-based
compensation is determined at the grant date and the recognition of the related expense is recorded over the period in
which the share-based compensation vests. Refer to Note 14 for additional information.