3M 2014 Annual Report Download - page 86
Download and view the complete annual report
Please find page 86 of the 2014 3M annual report below. You can navigate through the pages in the report by either clicking on the pages listed below, or by using the keyword search tool below to find specific information within the annual report.-
 1
1 -
2
-
3
-
4
-
5
-
6
-
7
-
8
-
9
-
10
-
11
-
12
-
13
-
14
-
15
-
16
-
17
-
18
-
19
-
20
-
21
-
22
-
23
-
24
-
25
-
26
-
27
-
28
-
29
-
30
-
31
-
32
-
33
-
34
-
35
-
36
-
37
-
38
-
39
-
40
-
41
-
42
-
43
-
44
-
45
-
46
-
47
-
48
-
49
-
50
-
51
-
52
-
53
-
54
-
55
-
56
-
57
-
58
-
59
-
60
-
61
-
62
-
63
-
64
-
65
-
66
-
67
-
68
-
69
-
70
-
71
-
72
-
73
-
74
-
75
-
 76
76 -
 77
77 -
 78
78 -
 79
79 -
 80
80 -
 81
81 -
 82
82 -
 83
83 -
 84
84 -
 85
85 -
 86
86 -
 87
87 -
 88
88 -
 89
89 -
 90
90 -
 91
91 -
 92
92 -
 93
93 -
 94
94 -
 95
95 -
 96
96 -
97
-
98
-
99
-
100
-
101
-
102
-
103
-
104
-
105
-
106
-
107
-
108
-
109
-
110
-
111
-
112
-
113
-
114
-
115
-
116
-
117
-
118
-
119
-
120
-
121
-
122
-
123
-
124
-
125
-
126
-
127
-
128
-
129
-
130
-
131
-
132
 |
 |

80
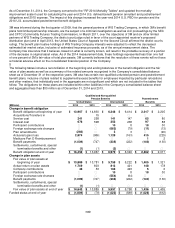
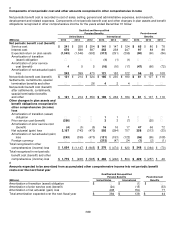
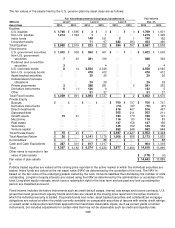
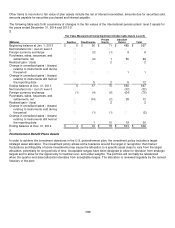
Components of net periodic cost and other amounts recognized in other comprehensive income
Net periodic benefit cost is recorded in cost of sales, selling, general and administrative expenses, and research,
development and related expenses. Components of net periodic benefit cost and other changes in plan assets and benefit
obligations recognized in other comprehensive income for the years ended December 31 follow:
Qualified and Non-qualified
Pension Benefits Postretirement
United States
International
Benefits
(Millions)
2014
2013
2012
2014
2013
2012
2014
2013
2012
Net periodic benefit cost (benefit)
Service cost
$
241
$
258 $ 254
$
141
$ 147
$
124
$
65
$
80 $ 78
Interest cost
676
598 587
252
238 247
97
88 86
Expected return on plan assets
(1,043)
(1,046) (992)
(312)
(291) (295)
(90)
(90) (84)
Amortization of transition
(asset) obligation
―
― ―
(1)
(1) (1)
―
― ―
Amortization of prior service
cost (benefit)
4
5 5
(16)
(16) (17)
(47)
(66) (72)
Amortization of net actuarial (gain)
loss
243
399 470
121
153 122
56
95 108
Net periodic benefit cost (benefit)
$
121
$
214 $ 324
$
185
$ 230
$
180
$
81
$
107 $ 116
Settlements, curtailments, special
termination benefits and other
―
― 26
4
2 4
―
― ―
Net periodic benefit cost (benefit)
after settlements, curtailments,
special termination benefits
and other
$
121
$
214 $ 350
$
189
$ 232
$
184
$
81
$
107 $ 116
Other changes in plan assets and
benefit obligations recognized in
other comprehensive (income)
loss
Amortization of transition (asset)
obligation
―
― ―
1
1 1
―
― ―
Prior service cost (benefit)
(266)
― ―
3
3 (7)
―
(20) ―
Amortization of prior service cost
(benefit)
(4)
(5) (5)
16
16 17
47
66 72
Net actuarial (gain) loss
2,167
(743) (470)
592
(294) 707
358
(313) (33)
Amortization of net actuarial (gain)
loss
(243)
(399) (470)
(121)
(153) (122)
(56)
(95) (108)
Foreign currency
―
― ―
(215)
(47) 24
(1)
(2) (1)
Total recognized in other
comprehensive (income) loss
$
1,654
$
(1,147) $ (945)
$
276
$ (474)
$
620 $ 348
$
(364) $ (70)
Total recognized in net periodic
benefit cost (benefit) and other
comprehensive (income) loss
$
1,775
$
(933) $ (595)
$
465
$ (242)
$
804 $ 429
$
(257) $ 46
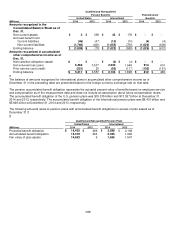
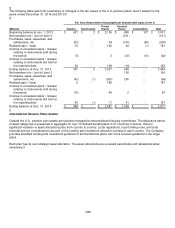
Amounts expected to be amortized from accumulated other comprehensive income into net periodic benefit
costs over the next fiscal year
Qualified and Non-qualified
Pension Benefits
Postretirement
(Millions)
United States
International
Benefits
Amortization of transition (asset) obligation $
― $
(1) $ ―
Amortization of prior service cost (benefit) (24) (15) (3
3)
Amortization of net actuarial (gain) loss
408 154 77
Total amortization expected over the next fiscal year $
384 $
138 $
44