3M 2014 Annual Report Download - page 91
Download and view the complete annual report
Please find page 91 of the 2014 3M annual report below. You can navigate through the pages in the report by either clicking on the pages listed below, or by using the keyword search tool below to find specific information within the annual report.-
 1
1 -
2
-
3
-
4
-
5
-
6
-
7
-
8
-
9
-
10
-
11
-
12
-
13
-
14
-
15
-
16
-
17
-
18
-
19
-
20
-
21
-
22
-
23
-
24
-
25
-
26
-
27
-
28
-
29
-
30
-
31
-
32
-
33
-
34
-
35
-
36
-
37
-
38
-
39
-
40
-
41
-
42
-
43
-
44
-
45
-
46
-
47
-
48
-
49
-
50
-
51
-
52
-
53
-
54
-
55
-
56
-
57
-
58
-
59
-
60
-
61
-
62
-
63
-
64
-
65
-
66
-
67
-
68
-
69
-
70
-
71
-
72
-
73
-
74
-
75
-
76
-
77
-
78
-
79
-
80
-
 81
81 -
 82
82 -
 83
83 -
 84
84 -
 85
85 -
 86
86 -
 87
87 -
 88
88 -
 89
89 -
 90
90 -
 91
91 -
 92
92 -
 93
93 -
 94
94 -
 95
95 -
 96
96 -
 97
97 -
 98
98 -
 99
99 -
 100
100 -
 101
101 -
102
-
103
-
104
-
105
-
106
-
107
-
108
-
109
-
110
-
111
-
112
-
113
-
114
-
115
-
116
-
117
-
118
-
119
-
120
-
121
-
122
-
123
-
124
-
125
-
126
-
127
-
128
-
129
-
130
-
131
-
132
 |
 |

85
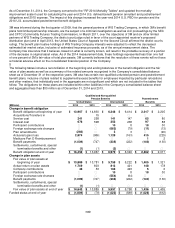
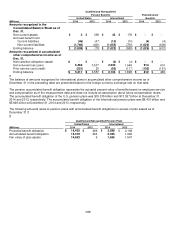
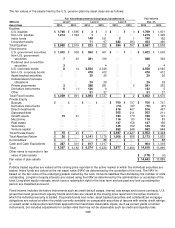
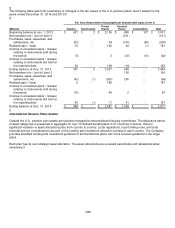
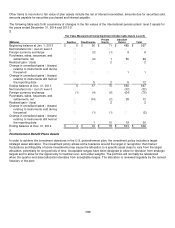
The following table sets forth a summary of changes in the fair values of the U.S. pension plans’ level 3 assets for the
years ended December 31, 2014 and 2013:
Fair Value Measurement Using Significant Unobservable Inputs (Level 3)
Equities
Fixed Income
Private
Equity
Absolute
Return
Commodities
Total (Millions)
Beginning balance at Jan. 1, 2013
$
421 $ 2
$
2,136 $ 865
$
107
$
3,531
Net transfers into / (out of) level 3
― ― ― (101) ― (101)
Purchases, sales, issuances, and
settlements, net
(92) ― 54 (104) (96) (238)
Realized gain / (loss)
10 ― 126 46 (1) 181
Change in unrealized gains / (losses)
relating to instruments sold during
the period
(5) ― 3 (30) (10) (42)
Change in unrealized gains / (losses)
relating to instruments still held at
the reporting date
63 ― 108 (18) ― 153
Ending balance at Dec. 31, 2013
397 2 2,427 658 ― 3,484
Net transfers into / (out of) level 3
― ― ― 100 ― 100
Purchases, sales, issuances, and
settlements, net
(43) (1) (260) 205 ― (99)
Realized gain / (loss)
2 ― 185 ― ― 187
Change in unrealized gains / (losses)
relating to instruments sold during
the period
(12) ― 64 2 ― 54
Change in unrealized gains / (losses)
relating to instruments still held at
the reporting date
40 (1) 71 41 ― 151
Ending balance at Dec. 31, 2014
$
384 $ ―
$
2,487 $ 1,006
$
―
$
3,877
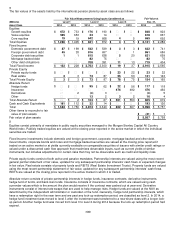
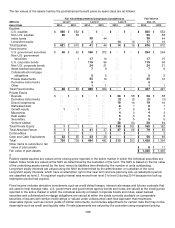
International Pension Plans Assets
Outside the U.S., pension plan assets are typically managed by decentralized fiduciary committees. The disclosure below
of asset categories is presented in aggregate for over 70 defined benefit plans in 27 countries; however, there is
significant variation in asset allocation policy from country to country. Local regulations, local funding rules, and local
financial and tax considerations are part of the funding and investment allocation process in each country. The Company
provides standard funding and investment guidance to all international plans with more focused guidance to the larger
plans.
Each plan has its own strategic asset allocation. The asset allocations are reviewed periodically and rebalanced when
necessary.