Westjet 2009 Annual Report Download - page 98
Download and view the complete annual report
Please find page 98 of the 2009 Westjet annual report below. You can navigate through the pages in the report by either clicking on the pages listed below, or by using the keyword search tool below to find specific information within the annual report.-
 1
1 -
2
-
3
-
4
-
5
-
6
-
7
-
8
-
9
-
10
-
11
-
12
-
13
-
14
-
15
-
16
-
17
-
18
-
19
-
20
-
21
-
22
-
23
-
24
-
25
-
26
-
27
-
28
-
29
-
30
-
31
-
32
-
33
-
34
-
35
-
36
-
37
-
38
-
39
-
40
-
41
-
42
-
43
-
44
-
45
-
46
-
47
-
48
-
49
-
50
-
51
-
52
-
53
-
54
-
55
-
56
-
57
-
58
-
59
-
60
-
61
-
62
-
63
-
64
-
65
-
66
-
67
-
68
-
69
-
70
-
71
-
72
-
73
-
74
-
75
-
76
-
77
-
78
-
79
-
80
-
81
-
82
-
83
-
84
-
85
-
86
-
87
-
 88
88 -
 89
89 -
 90
90 -
 91
91 -
 92
92 -
 93
93 -
 94
94 -
 95
95 -
 96
96 -
 97
97 -
 98
98 -
 99
99 -
 100
100 -
 101
101 -
 102
102 -
 103
103 -
 104
104 -
 105
105 -
 106
106 -
 107
107 -
 108
108 -
109
-
110
-
111
-
112
 |
 |

68 WestJet 2009 Annual Report
NOTES TO CONSOLIDATED
FINANCIAL STATEMENTS
For the years ended December 31, 2009 and 2008
(Stated in thousands of Canadian dollars, except share and per share data)
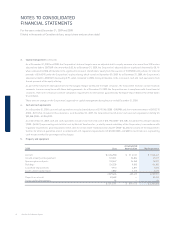
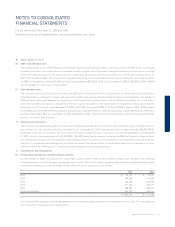
10. Share capital (continued)
(f) Employee share purchase plan (continued)
For the year ended December 31, 2009, for the Corporation’s matching contribution, the Corporation elected to issue a portion of the shares from
treasury. A total of 977,459 shares were issued at a total market value of $11,071 for which no cash was exchanged. The remaining shares were
acquired through the open market. For 2008, all shares were acquired through the open market.
The Corporation’s share of the contributions in 2009 amounted to $47,030 (2008 – $42,937) and is recorded as compensation expense within the
related business unit.
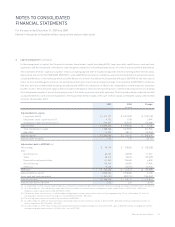
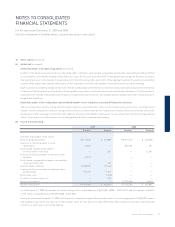
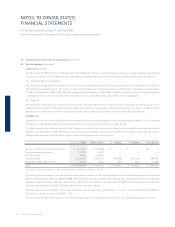
(g) Executive share unit plan
The Corporation has an equity-based executive share unit (ESU) plan, whereby restricted share units (RSU) and performance share units (PSU)
may be issued to senior executive offi cers. As at December 31, 2009, up to a maximum of 509,841 voting shares of the Corporation may be issued
under the ESU plan.
The fair market value of the RSUs and PSUs at the time of grant is equal to the weighted average trading price of the Corporation’s voting shares
for the fi ve trading days immediately preceding the grant date.
Each RSU entitles the senior executive offi cers to receive payment upon vesting in the form of voting shares of the Corporation. RSUs time vest
at the end of a three-year term, with compensation expense being recognized in net earnings over the vesting period.
Each PSU entitles the senior executive offi cers to receive payment upon vesting in the form of voting shares of the Corporation. PSUs time vest at
the end of a three-year term and incorporate performance criteria based on achieving compounded average diluted earnings per share growth
rate targets established at the time of grant. Compensation expense is recognized in net earnings over the vesting period based on the number
of units expected to vest.
2009
RSUs PSUs
Number of units
Weighted average grant
date fair value Number of units
Weighted average grant
date fair value
Units outstanding, beginning of year 55,181 $ 19.37 73,574 $ 19.37
Granted 105,491 11.36 140,650 11.36
Exercised (17,211) 14.16 (22,948) 14.16
Units outstanding, end of year 143,461 $ 14.10 191,276 $ 14.10
Vested, end of year — $ — — $ —
2008
RSUs PSUs
Number of units
Weighted average grant
date fair value Number of units
Weighted average grant
date fair value
Units outstanding, beginning of year — $ — — $ —
Granted 55,181 19.37 73,574 19.37
Exercised — — — —
Units outstanding, end of year 55,181 $ 19.37 73,574 $ 19.37
Vested, end of year — $ — — $ —
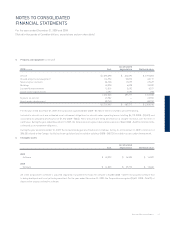
Stock-based compensation expense related to the ESU plan included in marketing, general and administration expense for the year ended
December 31, 2009, totalled $1,395 (2008 – $888).