Westjet 2009 Annual Report Download - page 38
Download and view the complete annual report
Please find page 38 of the 2009 Westjet annual report below. You can navigate through the pages in the report by either clicking on the pages listed below, or by using the keyword search tool below to find specific information within the annual report.-
 1
1 -
2
-
3
-
4
-
5
-
6
-
7
-
8
-
9
-
10
-
11
-
12
-
13
-
14
-
15
-
16
-
17
-
18
-
19
-
20
-
21
-
22
-
23
-
24
-
25
-
26
-
27
-
 28
28 -
 29
29 -
 30
30 -
 31
31 -
 32
32 -
 33
33 -
 34
34 -
 35
35 -
 36
36 -
 37
37 -
 38
38 -
 39
39 -
 40
40 -
 41
41 -
 42
42 -
 43
43 -
 44
44 -
 45
45 -
 46
46 -
 47
47 -
 48
48 -
49
-
50
-
51
-
52
-
53
-
54
-
55
-
56
-
57
-
58
-
59
-
60
-
61
-
62
-
63
-
64
-
65
-
66
-
67
-
68
-
69
-
70
-
71
-
72
-
73
-
74
-
75
-
76
-
77
-
78
-
79
-
80
-
81
-
82
-
83
-
84
-
85
-
86
-
87
-
88
-
89
-
90
-
91
-
92
-
93
-
94
-
95
-
96
-
97
-
98
-
99
-
100
-
101
-
102
-
103
-
104
-
105
-
106
-
107
-
108
-
109
-
110
-
111
-
112
 |
 |

8 WestJet 2009 Annual Report
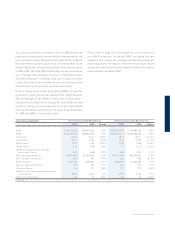
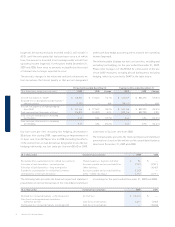
as compared to a $30.6 million gain in 2008. We also produced
an operating margin of 9.2 per cent, compared to 11.5 per cent
in the prior year.
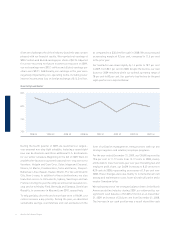
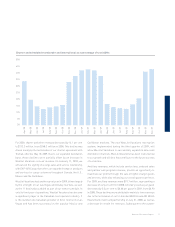
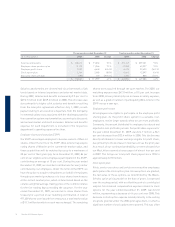
Our load factor was down slightly by 1.4 points to 78.7 per cent
in 2009, from 80.1 per cent in 2008. Despite the decline, our load
factor for 2009 remained within our optimal operating range of
78 per cent to 82 per cent. Our quarterly load factors for the past
eight quarters are depicted below.
form of utilization management, renegotiations with our key
strategic suppliers and voluntary employee programs.
For the year ended December 31, 2009, our CASM improved by
10.6 per cent to 11.77 cents from 13.17 cents in 2008, mainly
attributable to lower fuel costs year over year. Excluding fuel and
employee profi t share, our CASM increased to 8.45 cents from
8.29 cents in 2008, representing an increase of 1.9 per cent over
2008. These changes were due mainly to incremental aircraft
leasing and maintenance costs, lower aircraft utilization and a
weaker Canadian dollar.
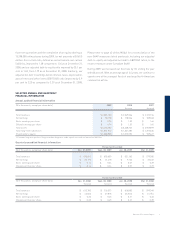
We maintained one of the strongest balance sheets in the North
American airline industry during 2009, as evidenced by our
signifi cant cash balance of $1,005.2 million as at December
31, 2009, an increase of 22.6 per cent from December 31, 2008.
The increase in our cash position was a result of positive cash
Given the challenges the airline industry faced this year, we are
pleased with our fi nancial results. We reported net earnings of
$98.2 million and diluted earnings per share of $0.74. Adjusted
for a non-recurring net future income tax reduction in 2009,
our net earnings were $93.1 million and diluted earnings per
share were $0.71. Additionally, our earnings in the year were
negatively impacted by non-operating items, including lower
interest income and a loss on foreign exchange of $12.3 million,
During the fourth quarter of 2009, we launched our largest-
ever seasonal non-stop fl ight schedule, featuring a record eight
new sun destinations and three additional U.S. destinations
for our winter schedule. Beginning in the fall of 2009, WestJet
and WestJet Vacations launched seasonal non-stop service to
Varadero, Holguin and Cayo Coco, Cuba; Ixtapa and Cozumel,
Mexico; St. Martin; Providenciales, Turks and Caicos; Freeport,
Bahamas; Lihue (Kauai), Hawaii; Miami, Florida; and Atlantic
City, New Jersey. In addition to these destinations, we also
launched service to Yellowknife, Sydney, San Diego and San
Francisco during the year. Recently, we announced seasonal non-
stop service to Kindley Field, Bermuda and Samana, Dominican
Republic, to commence in May and June 2010, respectively.
To help partially offset the decline we have seen in RASM, cost
control remains a key priority. During the year, we identifi ed
sustainable savings, cost deferrals and cost avoidances in the
Quarterly load factor
85%
80%
75%
70%
2008 Q1 2008 Q2 2008 Q3 2008 Q4 2009 Q1 2009 Q2 2009 Q3 2009 Q4