Westjet 2009 Annual Report Download - page 51
Download and view the complete annual report
Please find page 51 of the 2009 Westjet annual report below. You can navigate through the pages in the report by either clicking on the pages listed below, or by using the keyword search tool below to find specific information within the annual report.-
 1
1 -
2
-
3
-
4
-
5
-
6
-
7
-
8
-
9
-
10
-
11
-
12
-
13
-
14
-
15
-
16
-
17
-
18
-
19
-
20
-
21
-
22
-
23
-
24
-
25
-
26
-
27
-
28
-
29
-
30
-
31
-
32
-
33
-
34
-
35
-
36
-
37
-
38
-
39
-
40
-
 41
41 -
 42
42 -
 43
43 -
 44
44 -
 45
45 -
 46
46 -
 47
47 -
 48
48 -
 49
49 -
 50
50 -
 51
51 -
 52
52 -
 53
53 -
 54
54 -
 55
55 -
 56
56 -
 57
57 -
 58
58 -
 59
59 -
 60
60 -
 61
61 -
62
-
63
-
64
-
65
-
66
-
67
-
68
-
69
-
70
-
71
-
72
-
73
-
74
-
75
-
76
-
77
-
78
-
79
-
80
-
81
-
82
-
83
-
84
-
85
-
86
-
87
-
88
-
89
-
90
-
91
-
92
-
93
-
94
-
95
-
96
-
97
-
98
-
99
-
100
-
101
-
102
-
103
-
104
-
105
-
106
-
107
-
108
-
109
-
110
-
111
-
112
 |
 |

WestJet 2009 Annual Report 21
measurement for the North American airline industry. Our bag
ratio represents the number of delayed or lost baggage claims
made per 1,000 guests.
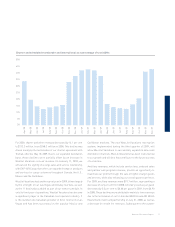
$165.0 million during the third quarter of 2009. Additionally, we
signed and drew upon a 4.315 per cent fi xed-rate, fi ve-year term
loan, secured by one 800-series aircraft, for a total of US $32.0
million during the fourth quarter of 2009. Part of our cash and
cash equivalents balance relates to cash collected with respect
to advance ticket sales, for which the balance at December
31, 2009, was $286.4 million, as compared to $251.4 million at
December 31, 2008. Typically, we have cash and cash equivalents
on hand to have suffi cient liquidity to meet our liabilities when
due, under both normal and stressed conditions. As at December
31, 2009, we had cash on hand of 3.51 (2008 – 3.26) times the
advance ticket sales balance. Additionally, the increase in our
working capital ratio to 1.48, from 1.24 as at December 31, 2008,
further demonstrates our fi nancial stability and strong fi nancial
position. Credit risk associated with cash and cash equivalents is
minimized substantially by ensuring that these fi nancial assets
are invested primarily in debt instruments with highly rated
fi nancial institutions. As at December 31, 2009, we have not been
required to post collateral with respect to any of our outstanding
derivative contracts.
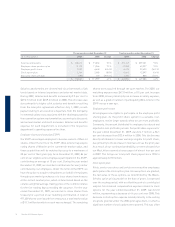
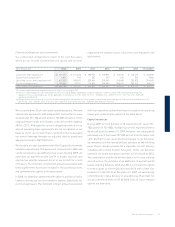
We monitor capital on a number of measures, including
adjusted debt-to-equity and adjusted net debt to EBITDAR
ratios. Our adjusted debt-to-equity ratio improved by 20.1 per
cent to 1.43 as at December 31, 2009, which included $779.7
million in off-balance-sheet aircraft operating leases. This
compared favourably to our adjusted debt-to-equity ratio of 1.79
at December 31, 2008, attributable to the signifi cant increase
in shareholders’ equity from the issuance of 15,398,500 voting
shares under our equity offering. As at December 31, 2009, our
adjusted net debt to EBITDAR ratio improved by 3.9 per cent to
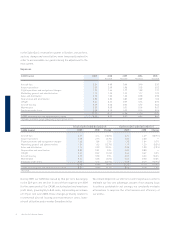
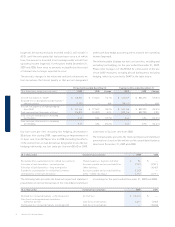
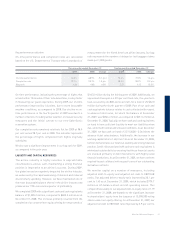
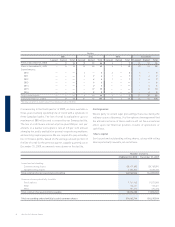
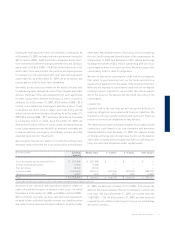
Key performance indicators
On-time performance and completion rates are calculated
based on the U.S. Department of Transportation’s standards of
On-time performance, indicating the percentage of fl ights that
arrived within 15 minutes of their scheduled time, is a key factor
in measuring our guest experience. During 2009, our on-time
performance improved by 1.6 points, due to more favourable
weather conditions, as compared to 2008. Our decline in on-
time performance in the fourth quarter of 2009 was due to a
number of factors, including winter weather, increased security
measures and the initial cutover to our new SabreSonic
reservation system.
Our completion rate remained relatively fl at for 2009 at 98.9
per cent versus 98.7 per cent in 2008. This indicator represents
the percentage of flights completed from flights originally
scheduled.
We also saw a signifi cant improvement in our bag ratio for 2009,
as compared to the prior year.
LIQUIDITY AND CAPITAL RESOURCES
The airline industry is highly sensitive to unpredictable
circumstances, and as such, maintaining a strong fi nancial
position is imperative to an airline’s success. During 2009,
the global recession negatively impacted the airline industry,
as evidenced by the rapid weakening of demand and reduced
discretionary spending. However, we have maintained one of
the most favourable balance sheets in the airline industry and
produced our 19th consecutive quarter of profi tability.
We completed 2009 with a signifi cant cash and cash equivalents
balance of $1,005.2 million, compared to $820.2 million as at
December 31, 2008. This increase primarily resulted from the
completion of an underwritten equity offering for net proceeds of
Three months ended December 31 Twelve months ended December 31
2009 2008 Change 2009 2008 Change
On-time performance 63.8% 68.9% (5.1 pts.) 78.6% 77.0% 1.6 pts.
Completion rate 99.1% 98.1% 1.0 pts. 98.9% 98.7% 0.2 pts.
Bag ratio 4.36 4.68 6.8% 3.57 4.12 13.3%