WeightWatchers 2007 Annual Report Download - page 92
Download and view the complete annual report
Please find page 92 of the 2007 WeightWatchers annual report below. You can navigate through the pages in the report by either clicking on the pages listed below, or by using the keyword search tool below to find specific information within the annual report.-
 1
1 -
2
-
3
-
4
-
5
-
6
-
7
-
8
-
9
-
10
-
11
-
12
-
13
-
14
-
15
-
16
-
17
-
18
-
19
-
20
-
21
-
22
-
23
-
24
-
25
-
26
-
27
-
28
-
29
-
30
-
31
-
32
-
33
-
34
-
35
-
36
-
37
-
38
-
39
-
40
-
41
-
42
-
43
-
44
-
45
-
46
-
47
-
48
-
49
-
50
-
51
-
52
-
53
-
54
-
55
-
56
-
57
-
58
-
59
-
60
-
61
-
62
-
63
-
64
-
65
-
66
-
67
-
68
-
69
-
70
-
71
-
72
-
73
-
74
-
75
-
76
-
77
-
78
-
79
-
80
-
81
-
 82
82 -
 83
83 -
 84
84 -
 85
85 -
 86
86 -
 87
87 -
 88
88 -
 89
89 -
 90
90 -
 91
91 -
 92
92 -
 93
93 -
 94
94 -
 95
95 -
 96
96 -
 97
97 -
 98
98 -
 99
99 -
 100
100 -
 101
101 -
 102
102 -
103
-
104
-
105
-
106
-
107
-
108
 |
 |

WEIGHT WATCHERS INTERNATIONAL, INC. AND SUBSIDIARIES
NOTES TO CONSOLIDATED FINANCIAL STATEMENTS—Continued
(IN THOUSANDS, EXCEPT PER SHARE AMOUNTS)
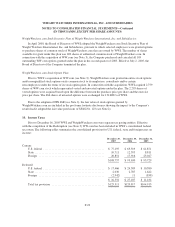
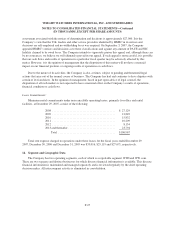
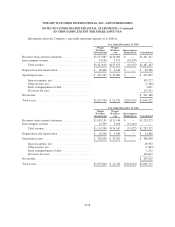
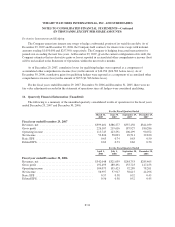
The following table presents information about the Company’s sources of revenue and other information by
geographic area. There were no material amounts of sales or transfers among geographic areas and no material
amounts of United States export sales.
Revenues for the Year Ended
December 29,
2007
December 30,
2006
December 31,
2005
NACO meeting fees ............................. $ 603,730 $ 471,751 $ 416,952
International company-owned meeting fees ........... 276,994 251,337 264,145
Product sales ................................... 337,659 293,286 285,448
Franchise royalties ............................... 17,039 19,168 19,393
Internet revenues ................................ 151,625 129,420 109,657
Other ......................................... 80,120 68,363 55,656
$1,467,167 $1,233,325 $1,151,251
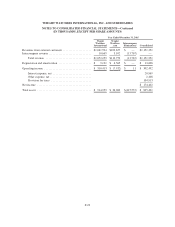
Revenues for the Year Ended
December 29,
2007
December 30,
2006
December 31,
2005
North America .................................. $ 972,976 $ 801,373 $ 699,981
United Kingdom ................................ 199,240 161,431 169,168
Continental Europe .............................. 237,196 215,151 219,175
Australia, New Zealand and other ................... 57,755 55,370 62,927
$1,467,167 $1,233,325 $1,151,251
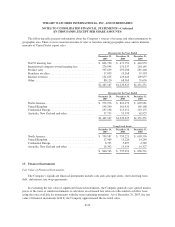
Long-Lived Assets
December 29,
2007
December 30,
2006
December 31,
2005
North America .................................. $ 799,587 $ 759,221 $ 603,356
United Kingdom ................................ 17,969 15,220 14,249
Continental Europe .............................. 6,795 5,697 4,589
Australia, New Zealand and other ................... 16,392 15,154 14,327
$ 840,743 $ 795,292 $ 636,521
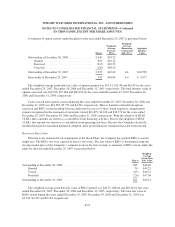
15. Financial Instruments
Fair Value of Financial Instruments:
The Company’s significant financial instruments include cash and cash equivalents, short and long-term
debt, and interest rate swap agreements.
In evaluating the fair value of significant financial instruments, the Company generally uses quoted market
prices of the same or similar instruments or calculates an estimated fair value on a discounted cash flow basis
using the rates available for instruments with the same remaining maturities. As of December 29, 2007, the fair
value of financial instruments held by the Company approximated the recorded value.
F-30