WeightWatchers 2007 Annual Report Download - page 47
Download and view the complete annual report
Please find page 47 of the 2007 WeightWatchers annual report below. You can navigate through the pages in the report by either clicking on the pages listed below, or by using the keyword search tool below to find specific information within the annual report.-
 1
1 -
2
-
3
-
4
-
5
-
6
-
7
-
8
-
9
-
10
-
11
-
12
-
13
-
14
-
15
-
16
-
17
-
18
-
19
-
20
-
21
-
22
-
23
-
24
-
25
-
26
-
27
-
28
-
29
-
30
-
31
-
32
-
33
-
34
-
35
-
36
-
 37
37 -
 38
38 -
 39
39 -
 40
40 -
 41
41 -
 42
42 -
 43
43 -
 44
44 -
 45
45 -
 46
46 -
 47
47 -
 48
48 -
 49
49 -
 50
50 -
 51
51 -
 52
52 -
 53
53 -
 54
54 -
 55
55 -
 56
56 -
 57
57 -
58
-
59
-
60
-
61
-
62
-
63
-
64
-
65
-
66
-
67
-
68
-
69
-
70
-
71
-
72
-
73
-
74
-
75
-
76
-
77
-
78
-
79
-
80
-
81
-
82
-
83
-
84
-
85
-
86
-
87
-
88
-
89
-
90
-
91
-
92
-
93
-
94
-
95
-
96
-
97
-
98
-
99
-
100
-
101
-
102
-
103
-
104
-
105
-
106
-
107
-
108
 |
 |

connection with developing or obtaining software for internal use. These costs are amortized over a period of
three to five years, the estimated useful life of the software. We periodically evaluate for impairment capitalized
software development costs by considering, among other factors, whether the software is still expected to provide
substantive service potential, and whether a significant change is being made or will be made to the software.
Share-Based Compensation
We adopted the provisions of FASB Statement No. 123R, “Share-Based Payment”, or FAS 123R, on
January 1, 2006. Upon adopting this standard, we began recognizing the cost of all share-based awards based on
their estimated grant-date fair value over the related service period of such awards. In accordance with FAS
123R, we have elected to apply the modified prospective transition method to all past awards outstanding and
unvested as of the date of adoption and have begun to recognize the associated expense over the remaining
vesting period based on the fair values previously determined and disclosed as part of our pro forma disclosures.
We have not restated the results of prior periods.
The fair value of restricted stock units and vested shares is determined by the market price of our common
stock on the date of grant. The fair value of option awards is estimated on the date of grant using the Black-
Scholes option pricing model, which requires estimates of the expected term of the option, the expected volatility
of the Company’s stock price, the risk-free interest rate and the expected dividend yield. We recognize expense
for all share-based awards based on the fair value of the number of awards we estimate will fully vest. A change
in these underlying assumptions will cause a change in the estimated fair value of share-based awards and the
underlying expense recorded. We continue to evaluate these estimates and assumptions and believe that these
assumptions are appropriate.
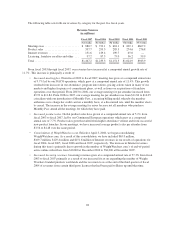
Results of Operations
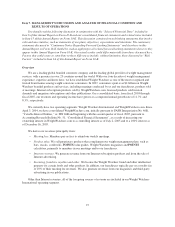
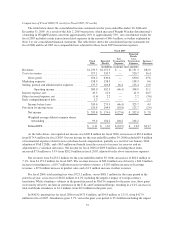
Comparison of Fiscal 2007 (52 weeks) to Fiscal 2006 (52 weeks)
Fiscal
2007
Fiscal
2006
Increase/
(Decrease)
Revenues ...................................................... $1,467.2 $1,233.3 $233.9
Cost of revenues ................................................ 653.3 557.1 96.2
Gross profit ................................................ 813.9 676.2 137.7
Marketing expenses ............................................. 205.3 158.9 46.4
Selling, general and administrative expenses .......................... 173.0 137.3 35.7
Operating income ........................................... 435.6 380.0 55.6
Interest expense, net ............................................. 109.3 49.5 59.8
Other income, net ............................................... (3.2) (1.4) (1.8)
Early extinguishment of debt ...................................... 3.0 1.3 1.7
Income before taxes ......................................... 326.5 330.6 (4.1)
Provision for income taxes ........................................ 125.3 120.8 4.5
Net income ................................................ $ 201.2 $ 209.8 $ (8.6)
Weighted average diluted common shares outstanding .................. 81.1 99.4
Diluted EPS .................................................... $ 2.48 $ 2.11 $ 0.37
Net revenues were $1,467.2 million for fiscal 2007, an increase of $233.9 million, or 19.0%, from $1,233.3
million for fiscal 2006. This $233.9 million increase was driven primarily by a $157.6 million increase in
meeting fees and a $44.4 million increase in product sales, both a result of attendance growth and higher average
sales per attendee. Internet and licensing revenues grew $22.2 million and $10.4 million respectively, with the
34