WeightWatchers 2007 Annual Report Download - page 42
Download and view the complete annual report
Please find page 42 of the 2007 WeightWatchers annual report below. You can navigate through the pages in the report by either clicking on the pages listed below, or by using the keyword search tool below to find specific information within the annual report.-
 1
1 -
2
-
3
-
4
-
5
-
6
-
7
-
8
-
9
-
10
-
11
-
12
-
13
-
14
-
15
-
16
-
17
-
18
-
19
-
20
-
21
-
22
-
23
-
24
-
25
-
26
-
27
-
28
-
29
-
30
-
31
-
 32
32 -
 33
33 -
 34
34 -
 35
35 -
 36
36 -
 37
37 -
 38
38 -
 39
39 -
 40
40 -
 41
41 -
 42
42 -
 43
43 -
 44
44 -
 45
45 -
 46
46 -
 47
47 -
 48
48 -
 49
49 -
 50
50 -
 51
51 -
 52
52 -
53
-
54
-
55
-
56
-
57
-
58
-
59
-
60
-
61
-
62
-
63
-
64
-
65
-
66
-
67
-
68
-
69
-
70
-
71
-
72
-
73
-
74
-
75
-
76
-
77
-
78
-
79
-
80
-
81
-
82
-
83
-
84
-
85
-
86
-
87
-
88
-
89
-
90
-
91
-
92
-
93
-
94
-
95
-
96
-
97
-
98
-
99
-
100
-
101
-
102
-
103
-
104
-
105
-
106
-
107
-
108
 |
 |

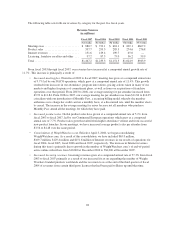
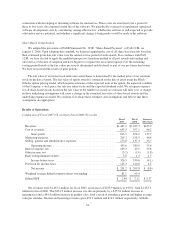
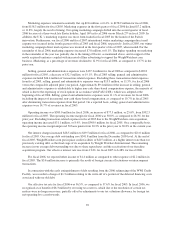
As shown in the chart below, our worldwide annual attendance in our company-owned operations (including
the aforementioned acquisitions of franchise operations) grew by 3.1%, from 60.8 million for fiscal 2003 to
62.7 million for fiscal 2007. From fiscal 2006 to fiscal 2007, worldwide annual attendance increased 2.6%.
In fiscal 2007, with Monthly Pass’ growing penetration in NACO, we introduced a new additional volume
metric in an effort to provide a greater degree of insight into our business. This new metric, meeting paid weeks,
captures total Weight Watchers paid meeting membership by adding paid commitment plan weeks to
pay-as-you-go weeks for a given period. Before the recent launch of our new commitment plans in the meeting
business, our members were largely on a pay-as-you-go (per attendance) basis, and, accordingly, growth in
attendance essentially approximated growth in meeting paid weeks. As you can see in the chart below, our
worldwide meeting paid weeks grew 23.0% in fiscal 2007, up from 94.0 million in fiscal 2006 to 115.6 million.
This compares to global attendance growth over the same period of 2.6%. In North America, where our Monthly
Pass commitment plan is highly penetrated, 2007 meeting paid weeks of 58.4 million exceeded attendance of
38.1 million by 53.3%.
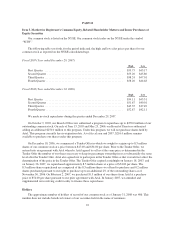
Meeting Attendance in Company-Owned Operations
(in millions)
Paid Weeks in Company-Owned Operations
(in millions)
Fiscal 2007 Fiscal 2006 Fiscal 2005 Fiscal 2004 Fiscal 2003 Fiscal 2007 Fiscal 2006
(52 weeks) (52 weeks) (52 weeks) (52 weeks) (53 weeks) (52 weeks) (52 weeks)
North America ......... 38.1 35.4 33.5 32.3 34.6 North America ......... 58.4 42.7
United Kingdom ....... 11.9 11.6 12.6 13.0 12.8 United Kingdom ....... 12.8 11.6
Continental Europe ..... 10.2 11.1 11.6 11.2 10.1 Continental Europe ..... 10.7 11.4
Other International ...... 2.5 3.0 3.2 3.4 3.3 Other International ...... 2.7 3.1
Total ............. 62.7 61.1 60.9 59.9 60.8 Total Meeting Paid Weeks 84.6 68.8
Online paid weeks ...... 31.0 25.2
Total Paid Weeks ..... 115.6 94.0
Looking historically and at trends, beginning in late 2003, our NACO attendance growth was adversely
affected by increased media exposure to and the resulting popularity of low-carbohydrate diets, which continued
through 2004. Beginning in the third quarter of fiscal 2004 through the first quarter of fiscal 2005, the declines in
organic NACO attendance, excluding the impact of acquisitions, versus prior year periods steadily improved
from minus 16.7% in the second quarter of fiscal 2004 to minus 13.9% in the third quarter of fiscal 2004 to
minus 8.7% in the fourth quarter of fiscal 2004 and to minus 5.1% in the first quarter of fiscal 2005. After that,
NACO attendance versus prior year periods moved into positive territory and posted increases of 5.3%, 2.5% and
6.5% in the second, third and fourth quarters of fiscal 2005, respectively. The third quarter of fiscal 2005 grew at
a slower pace due to the impact of Hurricane Katrina and its aftermath, compounded by two subsequent
hurricanes. In fiscal 2006, attendance for the full year grew at a rate of 5.7%, or 2.9% without the benefit of
acquisitions. In fiscal 2007, attendance for the full year grew at a rate of 7.7%, but declined 1.7% without the
benefit of acquisitions, and paid weeks grew 36.5%, due largely to the success of our Monthly Pass commitment
plan.
In the United Kingdom, after four years of attendance increases, attendance declined 3.1% in fiscal 2005
and 7.4% in fiscal 2006. The declining trend began as a result of a negative member and leader reaction to a new
program innovation launched in January 2005. We have worked to simplify the program, improve the meeting
experience, and strengthen the quality of our field management and leader force. As a result, over the course of
fiscal 2006, the negative U.K. attendance trend reversed from a negative 17.2% year-over-year decline in the first
quarter, to an 11.6% decline in the second quarter, to increases of 0.4% and 7.0% in third and fourth quarters of
fiscal 2006, respectively. This trend continued into the first quarter of 2007 with a growth rate of 9.8%, but the
growth slowed to 2.2% in the second quarter and turned negative in the second half, posting declines of 4.2% and
2.4% in the third and fourth quarter, respectively. Paid weeks rose 9.7%, from 11.6 million in fiscal 2006 to
12.8 million in fiscal 2007.
29