WeightWatchers 2007 Annual Report Download - page 83
Download and view the complete annual report
Please find page 83 of the 2007 WeightWatchers annual report below. You can navigate through the pages in the report by either clicking on the pages listed below, or by using the keyword search tool below to find specific information within the annual report.-
 1
1 -
2
-
3
-
4
-
5
-
6
-
7
-
8
-
9
-
10
-
11
-
12
-
13
-
14
-
15
-
16
-
17
-
18
-
19
-
20
-
21
-
22
-
23
-
24
-
25
-
26
-
27
-
28
-
29
-
30
-
31
-
32
-
33
-
34
-
35
-
36
-
37
-
38
-
39
-
40
-
41
-
42
-
43
-
44
-
45
-
46
-
47
-
48
-
49
-
50
-
51
-
52
-
53
-
54
-
55
-
56
-
57
-
58
-
59
-
60
-
61
-
62
-
63
-
64
-
65
-
66
-
67
-
68
-
69
-
70
-
71
-
72
-
 73
73 -
 74
74 -
 75
75 -
 76
76 -
 77
77 -
 78
78 -
 79
79 -
 80
80 -
 81
81 -
 82
82 -
 83
83 -
 84
84 -
 85
85 -
 86
86 -
 87
87 -
 88
88 -
 89
89 -
 90
90 -
 91
91 -
 92
92 -
 93
93 -
94
-
95
-
96
-
97
-
98
-
99
-
100
-
101
-
102
-
103
-
104
-
105
-
106
-
107
-
108
 |
 |

WEIGHT WATCHERS INTERNATIONAL, INC. AND SUBSIDIARIES
NOTES TO CONSOLIDATED FINANCIAL STATEMENTS—Continued
(IN THOUSANDS, EXCEPT PER SHARE AMOUNTS)
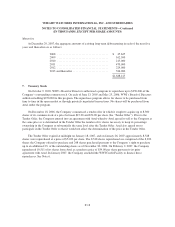
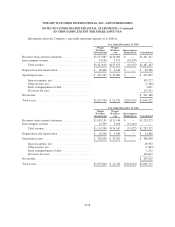
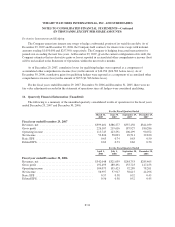
A summary of option activity under the plans for the year ended December 29, 2007 is presented below:
Shares
Weighted-
Average
Exercise
Price
Weighted-
Average
Remaining
Contractual
Life (Yrs.)
Aggregate
Intrinsic
Value
Outstanding at December 30, 2006 ................ 2,641 $33.52
Granted ................................. 623 $49.12
Exercised ................................ (913) $20.33
Canceled ................................ (126) $44.26
Outstanding at December 29, 2007 ................ 2,225 $42.69 6.4 $10,598
Exercisable at December 29, 2007 ................ 978 $36.84 4.0 $ 9,077
The weighted-average grant-date fair value of options granted was $15.41, $15.40 and $16.63 for the years
ended December 29, 2007, December 30, 2006 and December 31, 2005, respectively. The total intrinsic value of
options exercised was $28,876, $17,864 and $80,994 for the years ended December 29, 2007, December 30,
2006 and December 31, 2005, respectively.
Cash received from options exercised during the years ended December 29, 2007, December 30, 2006 and
December 31, 2005 was $18,563, $5,779 and $4,563, respectively. The tax benefits realized from options
exercised and RSUs vested resulting from tax deductions in excess of share-based employee compensation
expense recognized in the statement of operations totaled $10,879, $6,234 and $26,770 for the years ended
December 29, 2007, December 30, 2006 and December 31, 2005, respectively. With the adoption of SFAS
123(R), these amounts are shown as a cash inflow from financing activities. Prior to the adoption of SFAS
123(R), this amount was shown as a cash inflow from operating activities. Because the Company elected the
modified prospective transition method of adoption, prior period financial statements have not been restated.
Restricted Stock Units
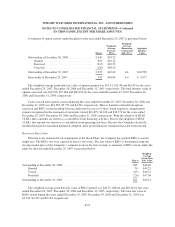
Pursuant to the restricted stock components of the Stock Plans, the Company has granted RSUs to certain
employees. The RSUs vest over a period of three to five years. The fair value of RSUs is determined using the
closing market price of the Company’s common stock on the date of grant. A summary of RSU activity under the
plans for the year ended December 29, 2007 is presented below:
Shares
Weighted-
Average
Grant-Date
Fair Value
Outstanding at December 30, 2006 .............................................. 282 $48.40
Granted ................................................................ 70 $49.25
Vested ................................................................. (65) $46.52
Forfeited ............................................................... (26) $47.96
Outstanding at December 29, 2007 .............................................. 261 $49.14
The weighted-average grant date fair value of RSUs granted was $49.25, $48.84 and $50.26 for the years
ended December 29, 2007, December 30, 2006 and December 31, 2005, respectively. The total fair value of
RSUs vested during the years ended December 29, 2007, December 30, 2006 and December 31, 2005 was
$3,130, $2,922 and $2,263, respectively.
F-21