United Healthcare 2009 Annual Report Download - page 74
Download and view the complete annual report
Please find page 74 of the 2009 United Healthcare annual report below. You can navigate through the pages in the report by either clicking on the pages listed below, or by using the keyword search tool below to find specific information within the annual report.-
 1
1 -
2
-
3
-
4
-
5
-
6
-
7
-
8
-
9
-
10
-
11
-
12
-
13
-
14
-
15
-
16
-
17
-
18
-
19
-
20
-
21
-
22
-
23
-
24
-
25
-
26
-
27
-
28
-
29
-
30
-
31
-
32
-
33
-
34
-
35
-
36
-
37
-
38
-
39
-
40
-
41
-
42
-
43
-
44
-
45
-
46
-
47
-
48
-
49
-
50
-
51
-
52
-
53
-
54
-
55
-
56
-
57
-
58
-
59
-
60
-
61
-
62
-
63
-
 64
64 -
 65
65 -
 66
66 -
 67
67 -
 68
68 -
 69
69 -
 70
70 -
 71
71 -
 72
72 -
 73
73 -
 74
74 -
 75
75 -
 76
76 -
 77
77 -
 78
78 -
 79
79 -
 80
80 -
 81
81 -
 82
82 -
 83
83 -
 84
84 -
85
-
86
-
87
-
88
-
89
-
90
-
91
-
92
-
93
-
94
-
95
-
96
-
97
-
98
-
99
-
100
-
101
-
102
-
103
-
104
-
105
-
106
-
107
-
108
-
109
-
110
-
111
-
112
-
113
-
114
-
115
-
116
-
117
-
118
-
119
-
120
-
121
-
122
-
123
-
124
-
125
-
126
-
127
-
128
-
129
-
130
-
131
-
132
-
133
-
134
-
135
-
136
-
137
 |
 |

UNITEDHEALTH GROUP
NOTES TO THE CONSOLIDATED FINANCIAL STATEMENTS—(Continued)
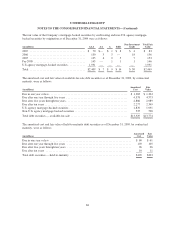
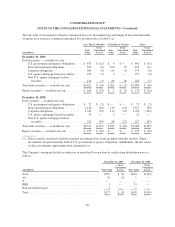
The following table presents information about the Company’s financial assets, excluding AARP, that are
measured at fair value on a recurring basis, according to the valuation techniques the Company used to determine
their fair values. See Note 13 of Notes to the Consolidated Financial Statements for further detail on AARP.
(in millions, except percentages)
Quoted Prices
in Active
Markets
(Level 1)
Other
Observable
Inputs
(Level 2)
Unobservable
Inputs
(Level 3)
Total Fair
Value
December 31, 2009
Cash and cash equivalents ............................ $ 9,135 $ 665 $— $ 9,800
Debt securities — available for sale:
U.S. government and agency obligations ............ 1,024 543 — 1,567
State and municipal obligations .................... — 6,317 — 6,317
Corporate obligations ........................... 18 3,293 110 3,421
U.S. agency mortgage-backed securities ............. — 1,931 — 1,931
Non-U.S. agency mortgage-backed securities ......... — 528 10 538
Total debt securities — available for sale ................ 1,042 12,612 120 13,774
Equity securities — available for sale ................... 262 3 312 577
Total cash, cash equivalents and investments at fair value . . . $10,439 $13,280 $432 $24,151
Percentage of total fair value .......................... 43% 55% 2% 100%
December 31, 2008
Cash and cash equivalents ............................ $ 6,564 $ 862 $— $ 7,426
Debt securities — available-for-sale:
U.S. government and agency obligations ............ 800 539 — 1,339
State and municipal obligations .................... — 6,484 — 6,484
Corporate obligations ........................... 7 2,650 46 2,703
U.S. agency mortgage-backed securities ............. — 2,307 — 2,307
Non-U.S. agency mortgage-backed securities ......... — 623 16 639
Total debt securities — available-for-sale ................ 807 12,603 62 13,472
Equity securities — available-for-sale .................. 170 3 304 477
Total cash, cash equivalents and investments at fair value . . . 7,541 13,468 366 21,375
Interest rate swaps .................................. — 622 — 622
Total assets at fair value ............................. $ 7,541 $14,090 $366 $21,997
Percentage of total fair value .......................... 34% 64% 2% 100%
The following methods and assumptions were used to estimate the fair value of each class of financial
instrument:
Cash and Cash Equivalents. The carrying value of cash and cash equivalents approximates fair value as
maturities are less than three months. Fair values of cash equivalent instruments that do not trade on a regular
basis in active markets are classified as Level 2.
Debt Securities. The estimated fair values of debt securities held as available-for-sale are based on quoted market
prices and/or other market data for the same or comparable instruments and transactions in establishing the
prices. Fair values of debt securities that do not trade on a regular basis in active markets are classified as
Level 2.
72