United Healthcare 2009 Annual Report Download - page 56
Download and view the complete annual report
Please find page 56 of the 2009 United Healthcare annual report below. You can navigate through the pages in the report by either clicking on the pages listed below, or by using the keyword search tool below to find specific information within the annual report.-
 1
1 -
2
-
3
-
4
-
5
-
6
-
7
-
8
-
9
-
10
-
11
-
12
-
13
-
14
-
15
-
16
-
17
-
18
-
19
-
20
-
21
-
22
-
23
-
24
-
25
-
26
-
27
-
28
-
29
-
30
-
31
-
32
-
33
-
34
-
35
-
36
-
37
-
38
-
39
-
40
-
41
-
42
-
43
-
44
-
45
-
 46
46 -
 47
47 -
 48
48 -
 49
49 -
 50
50 -
 51
51 -
 52
52 -
 53
53 -
 54
54 -
 55
55 -
 56
56 -
 57
57 -
 58
58 -
 59
59 -
 60
60 -
 61
61 -
 62
62 -
 63
63 -
 64
64 -
 65
65 -
 66
66 -
67
-
68
-
69
-
70
-
71
-
72
-
73
-
74
-
75
-
76
-
77
-
78
-
79
-
80
-
81
-
82
-
83
-
84
-
85
-
86
-
87
-
88
-
89
-
90
-
91
-
92
-
93
-
94
-
95
-
96
-
97
-
98
-
99
-
100
-
101
-
102
-
103
-
104
-
105
-
106
-
107
-
108
-
109
-
110
-
111
-
112
-
113
-
114
-
115
-
116
-
117
-
118
-
119
-
120
-
121
-
122
-
123
-
124
-
125
-
126
-
127
-
128
-
129
-
130
-
131
-
132
-
133
-
134
-
135
-
136
-
137
 |
 |

UnitedHealth Group
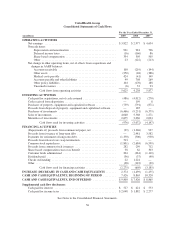
Consolidated Statements of Operations
For the Year Ended December 31,
(in millions, except per share data) 2009 2008 2007
REVENUES:
Premiums ..................................................... $79,315 $73,608 $68,781
Services ...................................................... 5,306 5,152 4,608
Products ...................................................... 1,925 1,655 898
Investment and other income ...................................... 592 771 1,144
Total revenues ............................................. 87,138 81,186 75,431
OPERATING COSTS:
Medical costs .................................................. 65,289 60,359 55,435
Operating costs ................................................. 12,734 13,103 10,583
Cost of products sold ............................................ 1,765 1,480 768
Depreciation and amortization ..................................... 991 981 796
Total operating costs ........................................ 80,779 75,923 67,582
EARNINGS FROM OPERATIONS .................................. 6,359 5,263 7,849
Interest expense ................................................ (551) (639) (544)
EARNINGS BEFORE INCOME TAXES .............................. 5,808 4,624 7,305
Provision for income taxes ........................................ (1,986) (1,647) (2,651)
NET EARNINGS .................................................. $ 3,822 $ 2,977 $ 4,654
BASIC NET EARNINGS PER COMMON SHARE ..................... $ 3.27 $ 2.45 $ 3.55
DILUTED NET EARNINGS PER COMMON SHARE .................. $ 3.24 $ 2.40 $ 3.42
BASIC WEIGHTED-AVERAGE NUMBER OF COMMON SHARES
OUTSTANDING ................................................ 1,168 1,214 1,312
DILUTIVE EFFECT OF COMMON STOCK EQUIVALENTS ........... 11 27 49
DILUTED WEIGHTED-AVERAGE NUMBER OF COMMON SHARES
OUTSTANDING ................................................ 1,179 1,241 1,361
ANTI-DILUTIVE SHARES EXCLUDED FROM THE CALCULATION
OF DILUTIVE EFFECT OF COMMON STOCK EQUIVALENTS ...... 107 90 38
See Notes to the Consolidated Financial Statements.
54