United Healthcare 2009 Annual Report Download - page 70
Download and view the complete annual report
Please find page 70 of the 2009 United Healthcare annual report below. You can navigate through the pages in the report by either clicking on the pages listed below, or by using the keyword search tool below to find specific information within the annual report.-
 1
1 -
2
-
3
-
4
-
5
-
6
-
7
-
8
-
9
-
10
-
11
-
12
-
13
-
14
-
15
-
16
-
17
-
18
-
19
-
20
-
21
-
22
-
23
-
24
-
25
-
26
-
27
-
28
-
29
-
30
-
31
-
32
-
33
-
34
-
35
-
36
-
37
-
38
-
39
-
40
-
41
-
42
-
43
-
44
-
45
-
46
-
47
-
48
-
49
-
50
-
51
-
52
-
53
-
54
-
55
-
56
-
57
-
58
-
59
-
 60
60 -
 61
61 -
 62
62 -
 63
63 -
 64
64 -
 65
65 -
 66
66 -
 67
67 -
 68
68 -
 69
69 -
 70
70 -
 71
71 -
 72
72 -
 73
73 -
 74
74 -
 75
75 -
 76
76 -
 77
77 -
 78
78 -
 79
79 -
 80
80 -
81
-
82
-
83
-
84
-
85
-
86
-
87
-
88
-
89
-
90
-
91
-
92
-
93
-
94
-
95
-
96
-
97
-
98
-
99
-
100
-
101
-
102
-
103
-
104
-
105
-
106
-
107
-
108
-
109
-
110
-
111
-
112
-
113
-
114
-
115
-
116
-
117
-
118
-
119
-
120
-
121
-
122
-
123
-
124
-
125
-
126
-
127
-
128
-
129
-
130
-
131
-
132
-
133
-
134
-
135
-
136
-
137
 |
 |

UNITEDHEALTH GROUP
NOTES TO THE CONSOLIDATED FINANCIAL STATEMENTS—(Continued)
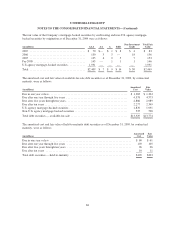
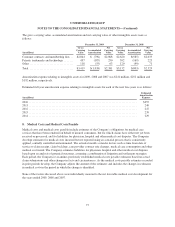
The fair value of the Company’s mortgage-backed securities by credit rating and non-U.S. agency mortgage-
backed securities by origination as of December 31, 2009 were as follows:
(in millions) AAA AA A BBB
Non-Investment
Grade
Total Fair
Value
2007 ....................................... $ 70 $— $1$8 $4 $ 83
2006 ....................................... 130 3 5 — 18 156
2005 ....................................... 135425 7 153
Pre-2005 .................................... 143 — 1 1 1 146
U.S agency mortgage-backed securities ............ 1,931 — — — — 1,931
Total ....................................... $2,409$7$9$14 $30 $2,469
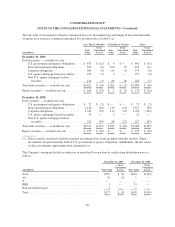
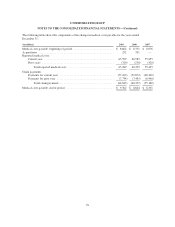
The amortized cost and fair value of available-for-sale debt securities as of December 31, 2009, by contractual
maturity, were as follows:
(in millions)
Amortized
Cost
Fair
Value
Due in one year or less ....................................................... $ 1,383 $ 1,394
Due after one year through five years ........................................... 4,378 4,573
Due after five years through ten years ........................................... 2,886 2,989
Due after ten years .......................................................... 2,277 2,349
U.S. agency mortgage-backed securities ......................................... 1,870 1,931
Non-U.S. agency mortgage-backed securities ..................................... 535 538
Total debt securities — available-for-sale ........................................ $13,329 $13,774
The amortized cost and fair value of held-to-maturity debt securities as of December 31, 2009, by contractual
maturity, were as follows:
(in millions)
Amortized
Cost
Fair
Value
Due in one year or less ......................................................... $ 60 $ 61
Due after one year through five years ............................................. 103 105
Due after five years through ten years ............................................. 26 26
Due after ten years ............................................................ 10 11
Total debt securities — held-to-maturity ........................................... $199 $203
68