United Healthcare 2009 Annual Report Download - page 44
Download and view the complete annual report
Please find page 44 of the 2009 United Healthcare annual report below. You can navigate through the pages in the report by either clicking on the pages listed below, or by using the keyword search tool below to find specific information within the annual report.-
 1
1 -
2
-
3
-
4
-
5
-
6
-
7
-
8
-
9
-
10
-
11
-
12
-
13
-
14
-
15
-
16
-
17
-
18
-
19
-
20
-
21
-
22
-
23
-
24
-
25
-
26
-
27
-
28
-
29
-
30
-
31
-
32
-
33
-
 34
34 -
 35
35 -
 36
36 -
 37
37 -
 38
38 -
 39
39 -
 40
40 -
 41
41 -
 42
42 -
 43
43 -
 44
44 -
 45
45 -
 46
46 -
 47
47 -
 48
48 -
 49
49 -
 50
50 -
 51
51 -
 52
52 -
 53
53 -
 54
54 -
55
-
56
-
57
-
58
-
59
-
60
-
61
-
62
-
63
-
64
-
65
-
66
-
67
-
68
-
69
-
70
-
71
-
72
-
73
-
74
-
75
-
76
-
77
-
78
-
79
-
80
-
81
-
82
-
83
-
84
-
85
-
86
-
87
-
88
-
89
-
90
-
91
-
92
-
93
-
94
-
95
-
96
-
97
-
98
-
99
-
100
-
101
-
102
-
103
-
104
-
105
-
106
-
107
-
108
-
109
-
110
-
111
-
112
-
113
-
114
-
115
-
116
-
117
-
118
-
119
-
120
-
121
-
122
-
123
-
124
-
125
-
126
-
127
-
128
-
129
-
130
-
131
-
132
-
133
-
134
-
135
-
136
-
137
 |
 |

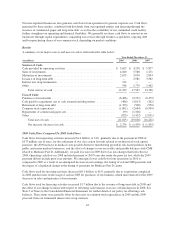
Our non-regulated businesses also generate cash flows from operations for general corporate use. Cash flows
generated by these entities, combined with dividends from our regulated entities and financing through the
issuance of commercial paper and long-term debt, as well as the availability of our committed credit facility,
further strengthen our operating and financial flexibility. We generally use these cash flows to reinvest in our
businesses through capital expenditures, expanding our services through business acquisitions, repaying debt
and/or repurchasing shares of our common stock, depending on market conditions.
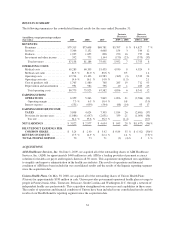
Results
A summary of our major sources and uses of cash is reflected in the table below:
Year Ended December 31,
(in millions) 2009 2008 2007
Sources of Cash:
Cash provided by operating activities ................................. $ 5,625 $ 4,238 $ 5,877
Sales of investments ............................................... 4,040 5,568 1,271
Maturities of investments ........................................... 2,675 3,030 2,094
Issuance of long-term debt .......................................... — 2,981 3,582
Interest rate swap termination ....................................... 513 — —
Other ........................................................... 546 1,770 1,962
Total sources of cash .......................................... 13,399 17,587 14,786
Uses of Cash:
Purchases of investments ........................................... (6,466) (9,251) (6,379)
Cash paid for acquisitions, net of cash assumed and disposition ............. (486) (3,813) (262)
Retirement of long-term debt ........................................ (1,350) (500) (950)
Common stock repurchases ......................................... (1,801) (2,684) (6,599)
Repayments of commercial paper, net ................................. (99) (1,346) —
Other ........................................................... (823) (1,432) (2,051)
Total uses of cash ............................................. (11,025) (19,026) (16,241)
Net increase (decrease) in cash .................................. $ 2,374 $ (1,439) $ (1,455)
2009 Cash Flows Compared To 2008 Cash Flows
Cash flows from operating activities increased $1.4 billion, or 33%, primarily due to the payment in 2008 of
$573 million, net of taxes, for the settlement of two class action lawsuits related to our historical stock option
practices, the 2009 increase in medical costs payable driven by membership growth in risk-based products in the
public and senior markets businesses, and the effect of changes to our receivable and payable balances with CMS
related to Medicare Part D. Additionally, we paid less taxes in 2009 due to tax law changes that took effect in
2008. Operating cash flows in 2008 included payment of 2007 taxes due under the prior tax law, while the 2009
payment did not include prior year amounts. We anticipate lower cash flows from operations in 2010 as
compared to 2009 as a result of an anticipated decrease in net earnings, the timing of certain CMS payments and
the impact of a legislated change to the timing of payments for Medicare Part D claims.
Cash flows used for investing activities decreased $4.1 billion, or 81%, primarily due to acquisitions completed
in 2008 and decreases in the usage of cash in 2009 for purchases of investments, which more than offset the 2009
decreases in sales and maturities of investments.
Cash flows used for financing activities increased $1.7 billion due to the issuance of long-term debt in 2008 and
the effect of our change in intent with respect to offsetting cash balances in excess of bank deposits in 2008. See
Note 2 of Notes to the Consolidated Financial Statements for further detail of our policy on offsetting cash
balances. These items were partially offset by decreases in common stock repurchases in 2009 and the 2009
proceeds from our terminated interest rate swap contracts.
42