Tesco 2014 Annual Report Download - page 95
Download and view the complete annual report
Please find page 95 of the 2014 Tesco annual report below. You can navigate through the pages in the report by either clicking on the pages listed below, or by using the keyword search tool below to find specific information within the annual report.-
 1
1 -
2
-
3
-
4
-
5
-
6
-
7
-
8
-
9
-
10
-
11
-
12
-
13
-
14
-
15
-
16
-
17
-
18
-
19
-
20
-
21
-
22
-
23
-
24
-
25
-
26
-
27
-
28
-
29
-
30
-
31
-
32
-
33
-
34
-
35
-
36
-
37
-
38
-
39
-
40
-
41
-
42
-
43
-
44
-
45
-
46
-
47
-
48
-
49
-
50
-
51
-
52
-
53
-
54
-
55
-
56
-
57
-
58
-
59
-
60
-
61
-
62
-
63
-
64
-
65
-
66
-
67
-
68
-
69
-
70
-
71
-
72
-
73
-
74
-
75
-
76
-
77
-
78
-
79
-
80
-
81
-
82
-
83
-
84
-
 85
85 -
 86
86 -
 87
87 -
 88
88 -
 89
89 -
 90
90 -
 91
91 -
 92
92 -
 93
93 -
 94
94 -
 95
95 -
 96
96 -
 97
97 -
 98
98 -
 99
99 -
 100
100 -
 101
101 -
 102
102 -
 103
103 -
 104
104 -
 105
105 -
106
-
107
-
108
-
109
-
110
-
111
-
112
-
113
-
114
-
115
-
116
-
117
-
118
-
119
-
120
-
121
-
122
-
123
-
124
-
125
-
126
-
127
-
128
-
129
-
130
-
131
-
132
-
133
-
134
-
135
-
136
-
137
-
138
-
139
-
140
-
141
-
142
-
143
-
144
-
145
-
146
-
147
 |
 |

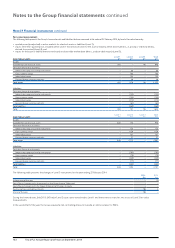
Note 11 Property, plant and equipment continued
Land and
buildings
£m
Other(a)
£m
Total
£m
Cost
At 25 February 2012 24,761 10,011 34,772
Foreign currency translation 428 173 601
Additions(b) 1,525 1,109 2,634
Acquired through business combinations 4 1 5
Reclassification (104) (28) (132)
Classified as held for sale (125) (4) (129)
Disposals (734) (116) (850)
Transfer to disposal group classified as held for sale (938) (320) (1,258)
At 23 February 2013 24,817 10,826 35,643
Accumulated depreciation and impairment losses
At 25 February 2012 2,951 6,111 9,062
Foreign currency translation 64 98 162
Charge for the year 448 874 1,322
Impairment losses 831 2833
Reversal of impairment losses (5) (1) (6)
Reclassification (6) 1(5)
Classified as held for sale (25) (2) (27)
Disposals (182) (98) (280)
Transfer to disposal group classified as held for sale (115) (173) (288)
At 23 February 2013 3,961 6,812 10,773
(a) (b) See page 91 for footnotes.
Impairment of property, plant and equipment
The Group has determined that for the purposes of impairment testing, each store is a cash-generating unit. Cash-generating units are tested for impairment
if there are indicators of impairment at the balance sheet date. Recoverable amounts for cash-generating units are based mainly on value in use but with
some based on fair value less costs of disposal where it gives a higher value.
Value in use is generally calculated from cash flow projections for five years using data from the Group’s latest internal forecasts, the results of which are reviewed
by the Board. The forecasts are extrapolated beyond five years based on estimated long-term growth rates of 2% to 5% (2013: 1% to 5%).
The key assumptions for the value in use calculations are those regarding discount rates, growth rates and expected changes in margins. Management estimates
discount rates using pre-tax rates that reflect the current market assessment of the time value of money and the risks specific to the cash-generating units.
Changes in selling prices and direct costs are based on past experience and expectations of future changes in the market. The pre-tax discount rates used to
calculate value in use range from 6% to 14% (2013: 7% to 12%) depending on the specific conditions in which each store operates. On a post-tax basis, the
discount rates range from 6% to 12% (2013: 5% to 10%). These discount rates are derived from the Group’s post-tax weighted average cost of capital, as
adjusted for the specific risks relating to each geographical region.
Fair value less costs of disposal for stores was determined by reference to rental yields and residual valuation approach.
The impairment losses relate to stores, distribution centres and work-in-progress sites. In the financial year, an impairment loss of £707m was recognised
relating to properties in Europe following a reduction in profits which resulted in a revision of long-term forecast cash flows. This was classified as ‘Impairment
of PPE and onerous lease provisions included within cost of sale’ within non-GAAP measures in the Group Income Statement.
The reversal of previous impairment losses arose due to changes in fair value less costs of disposal or in forecasts resulting in increased value in use.
92 Tesco PLC Annual Report and Financial Statements 2014
Notes to the Group financial statements continued