Tesco 2014 Annual Report Download - page 141
Download and view the complete annual report
Please find page 141 of the 2014 Tesco annual report below. You can navigate through the pages in the report by either clicking on the pages listed below, or by using the keyword search tool below to find specific information within the annual report.-
 1
1 -
2
-
3
-
4
-
5
-
6
-
7
-
8
-
9
-
10
-
11
-
12
-
13
-
14
-
15
-
16
-
17
-
18
-
19
-
20
-
21
-
22
-
23
-
24
-
25
-
26
-
27
-
28
-
29
-
30
-
31
-
32
-
33
-
34
-
35
-
36
-
37
-
38
-
39
-
40
-
41
-
42
-
43
-
44
-
45
-
46
-
47
-
48
-
49
-
50
-
51
-
52
-
53
-
54
-
55
-
56
-
57
-
58
-
59
-
60
-
61
-
62
-
63
-
64
-
65
-
66
-
67
-
68
-
69
-
70
-
71
-
72
-
73
-
74
-
75
-
76
-
77
-
78
-
79
-
80
-
81
-
82
-
83
-
84
-
85
-
86
-
87
-
88
-
89
-
90
-
91
-
92
-
93
-
94
-
95
-
96
-
97
-
98
-
99
-
100
-
101
-
102
-
103
-
104
-
105
-
106
-
107
-
108
-
109
-
110
-
111
-
112
-
113
-
114
-
115
-
116
-
117
-
118
-
119
-
120
-
121
-
122
-
123
-
124
-
125
-
126
-
127
-
128
-
129
-
130
-
 131
131 -
 132
132 -
 133
133 -
 134
134 -
 135
135 -
 136
136 -
 137
137 -
 138
138 -
 139
139 -
 140
140 -
 141
141 -
 142
142 -
 143
143 -
 144
144 -
 145
145 -
 146
146 -
 147
147
 |
 |

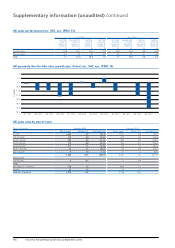
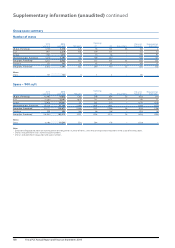
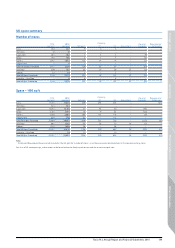
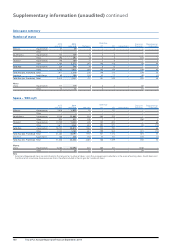
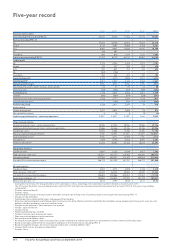
Number of stores
2013
year end
2014
year end Net gain1
Openings
Acquisitions
Closures/
Disposals
Repurposing/
ExtensionsH1 H2
UK (exc. Franchise) 3,146 3,370 224 78 125 33 (12) 2
Asia21,911 2,219 308 149 172 –(14) 50
Europe 1,365 1,374 920 28 –(39) 91
International (exc. Franchise) 3,276 3,593 317 169 200 –(53) 141
Group (exc. Franchise) 36,422 6,963 541 247 325 33 (65) 143
Franchise 231 342 111 43 85 –(16) 15
Group (inc. Franchise)36,653 7,305 652 290 410 33 (81) 158
Memo:
China 131 134 3 5 2 – (4) –
Space – ‘000 sq ft
2013
year end
2014
year end Net gain
Openings
Acquisitions
Closures/
Disposals
Repurposing/
ExtensionsH1 H2
UK (exc. Franchise) 40,495 41,813 1,318 549 884 58 (132) (41)
Asia231, 280 33,197 1,917 721 1,172 –( 31) 55
Europe 33,936 34,067 131 282 310 –(251) (210)
International (exc. Franchise) 65,216 67, 26 4 2,048 1,003 1,482 –(282) (155)
Group (exc. Franchise)3105,711 109,077 3,366 1,552 2,366 58 (414) (196)
Franchise 329 495 166 46 148 –(20) (8)
Group (inc. Franchise)3106,040 109,572 3,532 1,598 2, 514 58 (434) (204)
Memo:
China 10,196 10,546 350 394 176 –(220) –
Notes
1 Extensions/Repurposed stores are not included in the net gain for ‘number of stores’, since they are expansions/reductions in the space of existing stores.
2 China is excluded from Asia’s store and space numbers.
3 China is excluded from Group store and space numbers.
Group space summary
138 Tesco PLC Annual Report and Financial Statements 2014
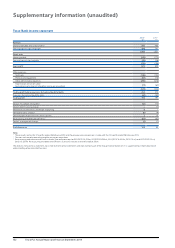
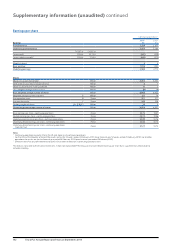
Supplementary information (unaudited) continued