Tesco 2014 Annual Report Download - page 119
Download and view the complete annual report
Please find page 119 of the 2014 Tesco annual report below. You can navigate through the pages in the report by either clicking on the pages listed below, or by using the keyword search tool below to find specific information within the annual report.-
 1
1 -
2
-
3
-
4
-
5
-
6
-
7
-
8
-
9
-
10
-
11
-
12
-
13
-
14
-
15
-
16
-
17
-
18
-
19
-
20
-
21
-
22
-
23
-
24
-
25
-
26
-
27
-
28
-
29
-
30
-
31
-
32
-
33
-
34
-
35
-
36
-
37
-
38
-
39
-
40
-
41
-
42
-
43
-
44
-
45
-
46
-
47
-
48
-
49
-
50
-
51
-
52
-
53
-
54
-
55
-
56
-
57
-
58
-
59
-
60
-
61
-
62
-
63
-
64
-
65
-
66
-
67
-
68
-
69
-
70
-
71
-
72
-
73
-
74
-
75
-
76
-
77
-
78
-
79
-
80
-
81
-
82
-
83
-
84
-
85
-
86
-
87
-
88
-
89
-
90
-
91
-
92
-
93
-
94
-
95
-
96
-
97
-
98
-
99
-
100
-
101
-
102
-
103
-
104
-
105
-
106
-
107
-
108
-
 109
109 -
 110
110 -
 111
111 -
 112
112 -
 113
113 -
 114
114 -
 115
115 -
 116
116 -
 117
117 -
 118
118 -
 119
119 -
 120
120 -
 121
121 -
 122
122 -
 123
123 -
 124
124 -
 125
125 -
 126
126 -
 127
127 -
 128
128 -
 129
129 -
130
-
131
-
132
-
133
-
134
-
135
-
136
-
137
-
138
-
139
-
140
-
141
-
142
-
143
-
144
-
145
-
146
-
147
 |
 |

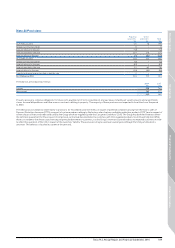
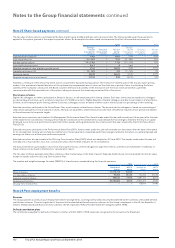
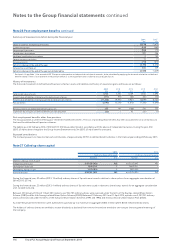
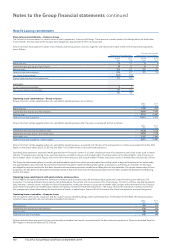
Summary of movements in deficit during the financial year
2014
£m
2013*
£m
Deficit in schemes at beginning of the year (2,378) (1,872)
Current service cost (542) (482)
Net pension finance cost (106) (73)
Contributions by employer 531 486
Additional contribution by employer 4180
Foreign currency translation 11 (7)
Remeasurements (713) (610)
Deficit in schemes at the end of the year (3,193) (2,378)
Deferred tax asset (Note 6) 634 539
Deficit in schemes at the end of the year net of deferred tax (2,559) (1,839)
* Restated – As per Note 1, the amended IAS 19 requires retrospective restatement of net interest amounts, to be calculated by applying the discount rate to the net defined
benefit liability. There is no movement in the pension deficit as asset outperformance is taken to actuarial gains/losses.
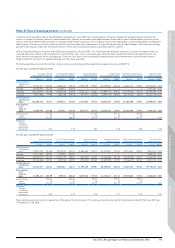
History of movements
The historical movement in defined benefit pension schemes’ assets and liabilities and history of experience gains and losses are as follows:
2014
£m
2013
£m
2012
£m
2011
£m
2010
£m
Total market value of assets 8,124 7,20 6 6,169 5,608 4,696
Present value of liabilities relating to unfunded pension schemes (111) (91) (60) (65) (54)
Present value of liabilities relating to partially funded pension schemes (11, 206) (9,493) ( 7,9 81) (6,899) (6,482)
Pension deficit (3,193) (2,378) (1,872) (1,356) (1,840)
Remeasurements on defined benefit pension assets 253 94 (168) 278 733
Experience (losses)/gains on defined benefit pension obligation (22) 143 (25) (1)
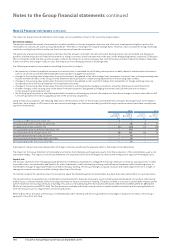
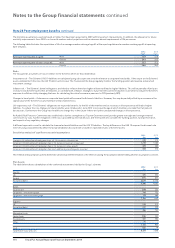
Post-employment benefits other than pensions
The Group operates a scheme offering post-retirement healthcare benefits. The cost of providing these benefits has been accounted for on a similar basis to
that used for defined benefit pension schemes.
The liability as at 22 February 2014 of £12m (2013: £12m) was determined in accordance with the advice of independent actuaries. During the year, £1m
(2013: £1m) has been charged to the Group Income Statement and £1m (2013: £1m) of benefits were paid.
Expected contributions
The Company expects to make normal cash contributions of approximately £579m to defined benefit schemes in the financial year ending 28 February 2015.
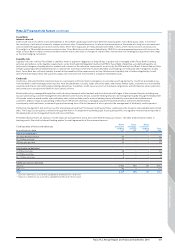
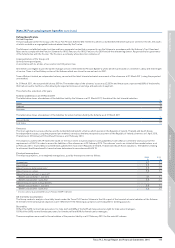
Note 27 Called up share capital
2014 2013
Ordinary shares of 5p each Ordinary shares of 5p each
Number £m Number £m
Allotted, called up and fully paid:
At beginning of the year 8,054,054,930 403 8,031,812,445 402
Share options exercised 19,662,145 118,632,251 1
Share bonus awards issued 22,104,016 13,610,234 –
At end of the year 8,095,821,091 405 8,054,054,930 403
During the financial year, 20 million (2013: 19 million) ordinary shares of 5p each were issued in relation to share options for an aggregate consideration of
£61m (2013: £57m).
During the financial year, 22 million (2013: 4 million) ordinary shares of 5p each were issued in relation to share bonus awards for an aggregate consideration
of £1.1m (2013: £0.2m).
Between 23 February 2014 and 11 April 2014 options over 942,705 ordinary shares were exercised under the terms of the Savings-related Share Option
Scheme (1981) and the Irish Savings-related Share Option Scheme (2000). Between 23 February 2014 and 11 April 2014, options over 2,207,051 ordinary
shares were exercised under the terms of the Executive Share Option Schemes (1994 and 1996) and the Discretionary Share Option Plan (2004).
As at 22 February 2014, the Directors were authorised to purchase up to a maximum in aggregate of 806.5 million (2013: 804.0 million) ordinary shares.
The holders of ordinary shares are entitled to receive dividends as declared from time to time and are entitled to one vote per share at general meetings of
the Company.
Note 26 Post-employment benefits continued
116 Tesco PLC Annual Report and Financial Statements 2014
Notes to the Group financial statements continued