Tesco 2014 Annual Report Download - page 138
Download and view the complete annual report
Please find page 138 of the 2014 Tesco annual report below. You can navigate through the pages in the report by either clicking on the pages listed below, or by using the keyword search tool below to find specific information within the annual report.-
 1
1 -
2
-
3
-
4
-
5
-
6
-
7
-
8
-
9
-
10
-
11
-
12
-
13
-
14
-
15
-
16
-
17
-
18
-
19
-
20
-
21
-
22
-
23
-
24
-
25
-
26
-
27
-
28
-
29
-
30
-
31
-
32
-
33
-
34
-
35
-
36
-
37
-
38
-
39
-
40
-
41
-
42
-
43
-
44
-
45
-
46
-
47
-
48
-
49
-
50
-
51
-
52
-
53
-
54
-
55
-
56
-
57
-
58
-
59
-
60
-
61
-
62
-
63
-
64
-
65
-
66
-
67
-
68
-
69
-
70
-
71
-
72
-
73
-
74
-
75
-
76
-
77
-
78
-
79
-
80
-
81
-
82
-
83
-
84
-
85
-
86
-
87
-
88
-
89
-
90
-
91
-
92
-
93
-
94
-
95
-
96
-
97
-
98
-
99
-
100
-
101
-
102
-
103
-
104
-
105
-
106
-
107
-
108
-
109
-
110
-
111
-
112
-
113
-
114
-
115
-
116
-
117
-
118
-
119
-
120
-
121
-
122
-
123
-
124
-
125
-
126
-
127
-
 128
128 -
 129
129 -
 130
130 -
 131
131 -
 132
132 -
 133
133 -
 134
134 -
 135
135 -
 136
136 -
 137
137 -
 138
138 -
 139
139 -
 140
140 -
 141
141 -
 142
142 -
 143
143 -
 144
144 -
 145
145 -
 146
146 -
 147
147
 |
 |

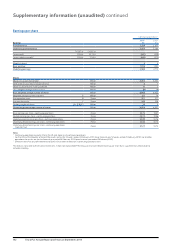
Continuing operations Discontinued operations Retail
2014
£m
2013
£m
2014
£m
2013
£m
2014
£m
2013
£m
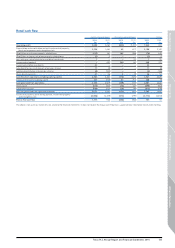
Operating profit 2,489 2,265 (925) (1,451) 1,564 814
Depreciation and amortisation and net impairment of property,
plant and equipment and intangible assets 2,156 1,465 42 677 2,198 2,142
(Profits)/losses arising on property-related items (232) 161 162 288 (70) 449
(Profit)/loss arising on sale of non property-related items (1) 4––(1) 4
Loss arising on sale of subsidiaries and other investments 1––35 135
Impairment of goodwill –495 540 80 540 575
Impairment of other investments 42 –––42 –
Adjustment for non-cash element of pensions charge 11 (4) ––11 (4)
Additional contribution into pension scheme (4) (180) ––(4) (180)
Share-based payments 41 56 5(2) 46 54
Cash flow from operations excluding working capital 4,503 4,262 (176) (373) 4,327 3,889
Decrease/(increase) in working capital 243 (253) 37 252 280 (1)
Cash generated from operations 4,746 4,009 (139) (121) 4,607 3,888
Interest paid (475) (421) (15) (27) (490) (448)
Corporation tax paid (594) (521) (18) (19) (612) (540)
Net cash generated from operating activities 3,677 3,067 (172) (167) 3,505 2,900
Purchase of property, plant and equipment, investment property
and intangible assets (2,500) (2,559) (274) (291) ( 2,774) (2,850)
Memo: Free cash flow 1,177 508 (446) (458) 731 50
The above is not a primary statement, nor a note to the financial statements. It does not replace the Group Cash Flow but is supplementary information to aid understanding.
Retail cash flow
Tesco PLC Annual Report and Financial Statements 2014 135
Other information
Governance Financial statementsStrategic report