Tesco 2014 Annual Report Download - page 139
Download and view the complete annual report
Please find page 139 of the 2014 Tesco annual report below. You can navigate through the pages in the report by either clicking on the pages listed below, or by using the keyword search tool below to find specific information within the annual report.-
 1
1 -
2
-
3
-
4
-
5
-
6
-
7
-
8
-
9
-
10
-
11
-
12
-
13
-
14
-
15
-
16
-
17
-
18
-
19
-
20
-
21
-
22
-
23
-
24
-
25
-
26
-
27
-
28
-
29
-
30
-
31
-
32
-
33
-
34
-
35
-
36
-
37
-
38
-
39
-
40
-
41
-
42
-
43
-
44
-
45
-
46
-
47
-
48
-
49
-
50
-
51
-
52
-
53
-
54
-
55
-
56
-
57
-
58
-
59
-
60
-
61
-
62
-
63
-
64
-
65
-
66
-
67
-
68
-
69
-
70
-
71
-
72
-
73
-
74
-
75
-
76
-
77
-
78
-
79
-
80
-
81
-
82
-
83
-
84
-
85
-
86
-
87
-
88
-
89
-
90
-
91
-
92
-
93
-
94
-
95
-
96
-
97
-
98
-
99
-
100
-
101
-
102
-
103
-
104
-
105
-
106
-
107
-
108
-
109
-
110
-
111
-
112
-
113
-
114
-
115
-
116
-
117
-
118
-
119
-
120
-
121
-
122
-
123
-
124
-
125
-
126
-
127
-
128
-
 129
129 -
 130
130 -
 131
131 -
 132
132 -
 133
133 -
 134
134 -
 135
135 -
 136
136 -
 137
137 -
 138
138 -
 139
139 -
 140
140 -
 141
141 -
 142
142 -
 143
143 -
 144
144 -
 145
145 -
 146
146 -
 147
147
 |
 |

1.0
0.5
0.0
(0.5)
(1.0)
(1.5)
(2.0)
(2.5)
(3.0)
(3.5)
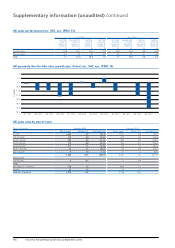
% growth
Q1 11/12 Q2 11/12 Q3 11/12 Q4 11/12 Q1 12/13 Q2 12/13 Q3 12/13 Q4 12/13 Q1 13/14 Q2 13/14 Q3 13/14 Q4 13/14
Inc. Petrol Exc. Petrol
First Half
2013/14
26 wks to
24/08/13
%
Second Half
2013/14
26 wks to
22/02/14
%
Full Year
2013/14
52 wks to
22/02/14
%
Full Year
2012/13
52 wks to
23/02/13
%
First Half
2013/14
26 wks to
24/08/13
%
Second Half
2013/14
26 wks to
22/02/14
%
Full Year
2013/14
52 wks to
22/02/14
%
Full Year
2012/13
52 wks to
23/02/13
%
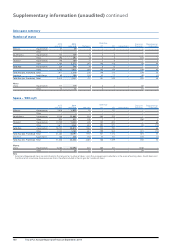
Existing stores (0.9) ( 3.1) (2.0) (1.0) (0.5) (2.2) (1.3) (0.3)
Net new stores 2.0 1.9 1.9 2.8 2.2 2.1 2.1 2.9
Total 1.1 (1.2) (0.1) 1.8 1.7 (0.1) 0.8 2.6
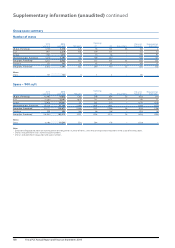
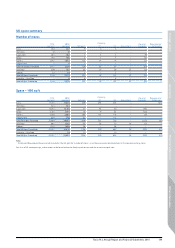
UK quarterly like-for-like sales growth (exc. Petrol, exc. VAT, exc. IFRIC 13)
UK sales area by size of store
Tesco store size February 2014 February 2013
sq ft No. of stores Million sq ft % of total sq ft No. of stores Million sq ft % of total sq ft
0-3,000 1,648 3.9 10.2% 1,527 3.6 9.7%
3,001-20,000 319 4.0 10.5% 313 4.0 10.6%
20,001-40,000 300 8.9 23.4% 299 8.9 23.9%
40,001-60,000 170 9.0 23.5% 165 8.7 23.3%
60,001-80,000 117 7.4 19.3% 113 7.1 19.1%
80,001-100,000 45 4.1 10.6% 43 3.9 10.5%
Over 100,000 91.0 2.5% 10 1.1 2.9%
2,608 38.3 100.0% 2,470 37.4 100.0%
Dotcom only
Over 60,000 60.7 50.6
Other
One Stop (inc. Franchise) 730 1.2 639 1.0
Dobbies 34 1.6 32 1.5
Total (inc. Franchise) 3,378 41.8 3,146 40.5
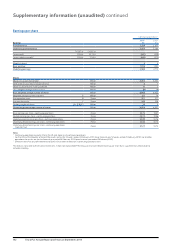
UK sales performance (inc. VAT, exc. IFRIC 13)
136 Tesco PLC Annual Report and Financial Statements 2014
Supplementary information (unaudited) continued