Tesco 2014 Annual Report Download - page 91
Download and view the complete annual report
Please find page 91 of the 2014 Tesco annual report below. You can navigate through the pages in the report by either clicking on the pages listed below, or by using the keyword search tool below to find specific information within the annual report.-
 1
1 -
2
-
3
-
4
-
5
-
6
-
7
-
8
-
9
-
10
-
11
-
12
-
13
-
14
-
15
-
16
-
17
-
18
-
19
-
20
-
21
-
22
-
23
-
24
-
25
-
26
-
27
-
28
-
29
-
30
-
31
-
32
-
33
-
34
-
35
-
36
-
37
-
38
-
39
-
40
-
41
-
42
-
43
-
44
-
45
-
46
-
47
-
48
-
49
-
50
-
51
-
52
-
53
-
54
-
55
-
56
-
57
-
58
-
59
-
60
-
61
-
62
-
63
-
64
-
65
-
66
-
67
-
68
-
69
-
70
-
71
-
72
-
73
-
74
-
75
-
76
-
77
-
78
-
79
-
80
-
 81
81 -
 82
82 -
 83
83 -
 84
84 -
 85
85 -
 86
86 -
 87
87 -
 88
88 -
 89
89 -
 90
90 -
 91
91 -
 92
92 -
 93
93 -
 94
94 -
 95
95 -
 96
96 -
 97
97 -
 98
98 -
 99
99 -
 100
100 -
 101
101 -
102
-
103
-
104
-
105
-
106
-
107
-
108
-
109
-
110
-
111
-
112
-
113
-
114
-
115
-
116
-
117
-
118
-
119
-
120
-
121
-
122
-
123
-
124
-
125
-
126
-
127
-
128
-
129
-
130
-
131
-
132
-
133
-
134
-
135
-
136
-
137
-
138
-
139
-
140
-
141
-
142
-
143
-
144
-
145
-
146
-
147
 |
 |

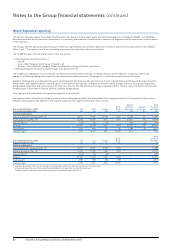
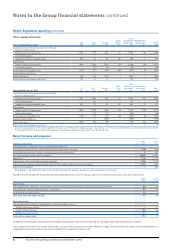
Note 8 Dividends
2014 2013
pence/share £m pence/share £m
Amounts recognised as distributions to owners in the financial year:
Prior financial year final dividend 10.13 815 10.13 813
Current financial year interim dividend 4.63 374 4.63 371
Dividends paid to equity owners in the financial year 14.76 1,189 14.76 1,184
Current financial year proposed final dividend 10.13 819 10.13 815
The proposed final dividend was approved by the Board of Directors on 15 April 2014 and is subject to the approval of shareholders at the Annual General
Meeting. The proposed dividend has not been included as a liability as at 22 February 2014, in accordance with IAS 10 ‘Events after the reporting period’.
It will be paid on 4 July 2014 to shareholders who are on the Register of members at close of business on 2 May 2014.
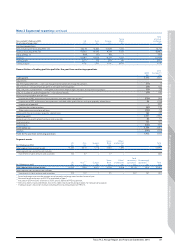
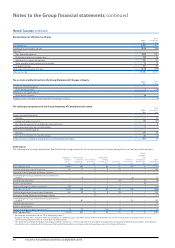
Note 9 Earnings per share and diluted earnings per share
Basic earnings per share amounts are calculated by dividing the profit attributable to owners of the parent by the weighted average number of ordinary
shares in issue during the financial year.
Diluted earnings per share amounts are calculated by dividing the profit attributable to owners of the parent by the weighted average number of ordinary
shares in issue during the financial year adjusted for the effects of potentially dilutive options. The dilutive effect is calculated on the full exercise of all
potentially dilutive ordinary share options granted by the Group, including performance-based options which the Group considers to have been earned.
2014 2013 (restated*)
Basic
Potentially
dilutive
share options Diluted Basic
Potentially
dilutive
share options Diluted
Profit/(loss) (£m)
Continuing operations 1,916 –1,916 1,532 –1,532
Discontinued operations (942) –(942) (1,504) –(1,504)
Weighted average number of shares (millions) 8,068 10 8,078 8,033 48,037
Earnings per share (pence)
Continuing operations 23.75 (0.03) 23.72 19.07 (0.01) 19.06
Discontinued operations (11.6 8) 0.02 (11.66) (18.72) 0.01 (18.71)
Total 12.07 (0.01) 12.06 0.35 – 0.35
There have been no transactions involving ordinary shares between the reporting date and the date of approval of these financial statements which would
significantly change the earnings per share calculations shown above.
Reconciliation of non-GAAP underlying diluted earnings per share
2014 2013 (restated*)
£m pence/share £m pence/share
Profit from continuing operations (Diluted) 1,916 23.72 1,532 19.06
Adjustments for:
IAS 32 and IAS 39 ‘Financial Instruments’ – fair value remeasurements 11 0.14 15 0.19
IAS 19 ‘Employee Benefits’ – non-cash Group Income Statement charge for pensions 117 1.45 69 0.86
IAS 17 ‘Leases’ – impact of annual uplifts in rent and rent-free periods 22 0.27 17 0.21
IFRS 3 ‘Business Combinations’ – intangible asset amortisation charges and
costs arising from acquisitions 14 0.17 19 0.24
IFRIC 13 ‘Customer Loyalty Programmes’ – fair value of awards 10 0.12 28 0.35
Restructuring and other one-off costs:
Impairment of PPE and onerous lease provisions included within costs of sales 734 9.09 161 2.00
Impairment of PPE and onerous lease provisions included within profits/losses arising on property-related items (98) (1.21) 709 8.82
Impairment of goodwill – – 495 6.16
Provision for customer redress 63 0.78 115 1.43
Other restructuring and one-off items 102 1.26 14 0.17
Other profits/losses arising on property-related items (180) (2.23) (419) (5.21)
Tax effect of adjustments at the effective rate of tax** (2014: 15.4%, 2013: 17.4%) (122) (1. 51) (43) (0.54)
Underlying earnings from continuing operations 2,589 32.05 2,712 33.74
* Restated for amendments to IAS 19 as explained in Note 1.
** The effective tax rate of 15.4% (2013: 17.4%) excludes certain permanent differences on which tax relief is not available.
88 Tesco PLC Annual Report and Financial Statements 2014
Notes to the Group financial statements continued