Tesco 2014 Annual Report Download - page 83
Download and view the complete annual report
Please find page 83 of the 2014 Tesco annual report below. You can navigate through the pages in the report by either clicking on the pages listed below, or by using the keyword search tool below to find specific information within the annual report.-
 1
1 -
2
-
3
-
4
-
5
-
6
-
7
-
8
-
9
-
10
-
11
-
12
-
13
-
14
-
15
-
16
-
17
-
18
-
19
-
20
-
21
-
22
-
23
-
24
-
25
-
26
-
27
-
28
-
29
-
30
-
31
-
32
-
33
-
34
-
35
-
36
-
37
-
38
-
39
-
40
-
41
-
42
-
43
-
44
-
45
-
46
-
47
-
48
-
49
-
50
-
51
-
52
-
53
-
54
-
55
-
56
-
57
-
58
-
59
-
60
-
61
-
62
-
63
-
64
-
65
-
66
-
67
-
68
-
69
-
70
-
71
-
72
-
 73
73 -
 74
74 -
 75
75 -
 76
76 -
 77
77 -
 78
78 -
 79
79 -
 80
80 -
 81
81 -
 82
82 -
 83
83 -
 84
84 -
 85
85 -
 86
86 -
 87
87 -
 88
88 -
 89
89 -
 90
90 -
 91
91 -
 92
92 -
 93
93 -
94
-
95
-
96
-
97
-
98
-
99
-
100
-
101
-
102
-
103
-
104
-
105
-
106
-
107
-
108
-
109
-
110
-
111
-
112
-
113
-
114
-
115
-
116
-
117
-
118
-
119
-
120
-
121
-
122
-
123
-
124
-
125
-
126
-
127
-
128
-
129
-
130
-
131
-
132
-
133
-
134
-
135
-
136
-
137
-
138
-
139
-
140
-
141
-
142
-
143
-
144
-
145
-
146
-
147
 |
 |

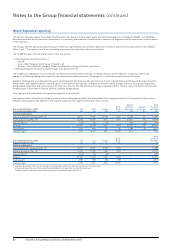
Note 2 Segmental reporting
The Group’s reporting segments are determined based on the Group’s internal reporting to the Chief Operating Decision Maker (‘CODM’). The CODM has
been determined to be the Executive Committee as it is primarily responsible for the allocation of resources to segments and the assessment of performance
of the segments.
The Group’s Chinese (previously reported as part of the Asia segment) and US operations have been treated as discontinued as described in more detail in
Notes 1 and 7. The segment results do not include any amounts for these discontinued operations.
The CODM considers the principal activities of the Group to be:
• Retailing and associated activities in:
−the UK;
−Asia – India, Malaysia, South Korea, Thailand; and
−Europe – Czech Republic, Hungary, Poland, the Republic of Ireland, Slovakia, and Turkey.
• Retail banking and insurance services through Tesco Bank in the UK.
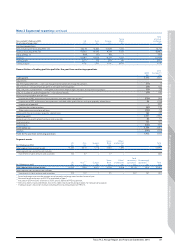
The CODM uses trading profit, as reviewed at monthly Executive Committee meetings, as the key measure of the segments’ results as it reflects the
segments’ underlying trading performance for the financial year under evaluation. Trading profit is a consistent measure within the Group.
Segment trading profit is an adjusted measure of operating profit and measures the performance of each segment before profits/losses arising on property-
related items, the impact on leases of annual uplifts in rent and rent-free periods, intangible asset amortisation charges and costs arising from acquisitions,
and goodwill impairment and restructuring and other one-off costs. The IAS 19 pension charge is replaced with the ‘normal’ cash contributions for pensions.
An adjustment is also made for the fair value of customer loyalty awards.
Inter-segment revenue between the operating segments is not material.
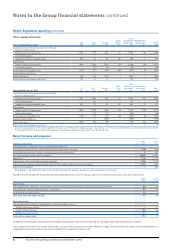
The segment results, which do not include any amounts for discontinued operations, the reconciliation of the segment measures to the respective statutory items
included in the Group Income Statement, the segment assets and other segment information are as follows:
Year ended 22 February 2014
At constant exchange rates*
UK
£m
Asia
£m
Europe
£m
Tesco
Bank
£m
Total at
constant
exchange
£m
Foreign
exchange
£m
Total
at actual
exchange
£m
Continuing operations
Sales including VAT (excluding IFRIC 13) 48,177 10,807 10,595 1,003 70,582 312 70,894
Revenue (excluding IFRIC 13) 43,570 10,181 9,117 1,003 63,871 278 64,149
Effect of IFRIC 13 (513) (32) (45) –(590) (2) (592)
Revenue 43,057 10,149 9,072 1,003 63,281 276 63,557
Trading profit 2,191 683 221 194 3,289 26 3,315
Trading margin†5.0% 6.7% 2.4% 19.3% 5.1% –5.2%
Year ended 22 February 2014
At actual exchange rates**
UK
£m
Asia
£m
Europe
£m
Tesco
Bank
£m
Total
at actual
exchange
£m
Continuing operations
Sales including VAT (excluding IFRIC 13) 48,177 10,947 10,767 1,003 70,894
Revenue (excluding IFRIC 13) 43,570 10,309 9,267 1,003 64,149
Effect of IFRIC 13 (513) (33) (46) –(592)
Revenue 43,057 10,276 9,221 1,003 63,557
Trading profit 2,191 692 238 194 3,315
Trading margin†5.0% 6.7% 2.6% 19.3% 5.2%
* Constant exchange rates are the average actual periodic exchange rates for the previous financial year.
** Actual exchange rates are the average actual periodic exchange rates for that financial year.
† Trading margin is based on revenue excluding the accounting impact of IFRIC 13.
80 Tesco PLC Annual Report and Financial Statements 2014
Notes to the Group financial statements continued