Suzuki 2015 Annual Report Download - page 7
Download and view the complete annual report
Please find page 7 of the 2015 Suzuki annual report below. You can navigate through the pages in the report by either clicking on the pages listed below, or by using the keyword search tool below to find specific information within the annual report.-
 1
1 -
 2
2 -
 3
3 -
 4
4 -
 5
5 -
 6
6 -
 7
7 -
 8
8 -
 9
9 -
 10
10 -
 11
11 -
 12
12 -
 13
13 -
 14
14 -
 15
15 -
 16
16 -
 17
17 -
 18
18 -
19
-
20
-
21
-
22
-
23
-
24
-
25
-
26
-
27
-
28
-
29
-
30
-
31
-
32
-
33
-
34
-
35
-
36
-
37
-
38
-
39
-
40
-
41
-
42
-
43
-
44
-
45
-
46
-
47
-
48
-
49
-
50
-
51
-
52
-
53
-
54
-
55
-
56
-
57
-
58
-
59
-
60
-
61
-
62
-
63
-
64
-
65
-
66
-
67
-
68
-
69
-
70
-
71
-
72
 |
 |
SUZUKI MOTOR CORPORATION 5
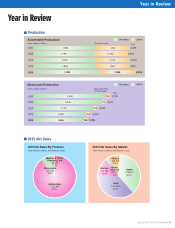
Year in Review
Year in Review
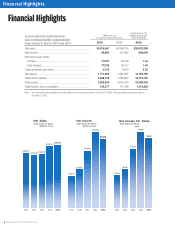
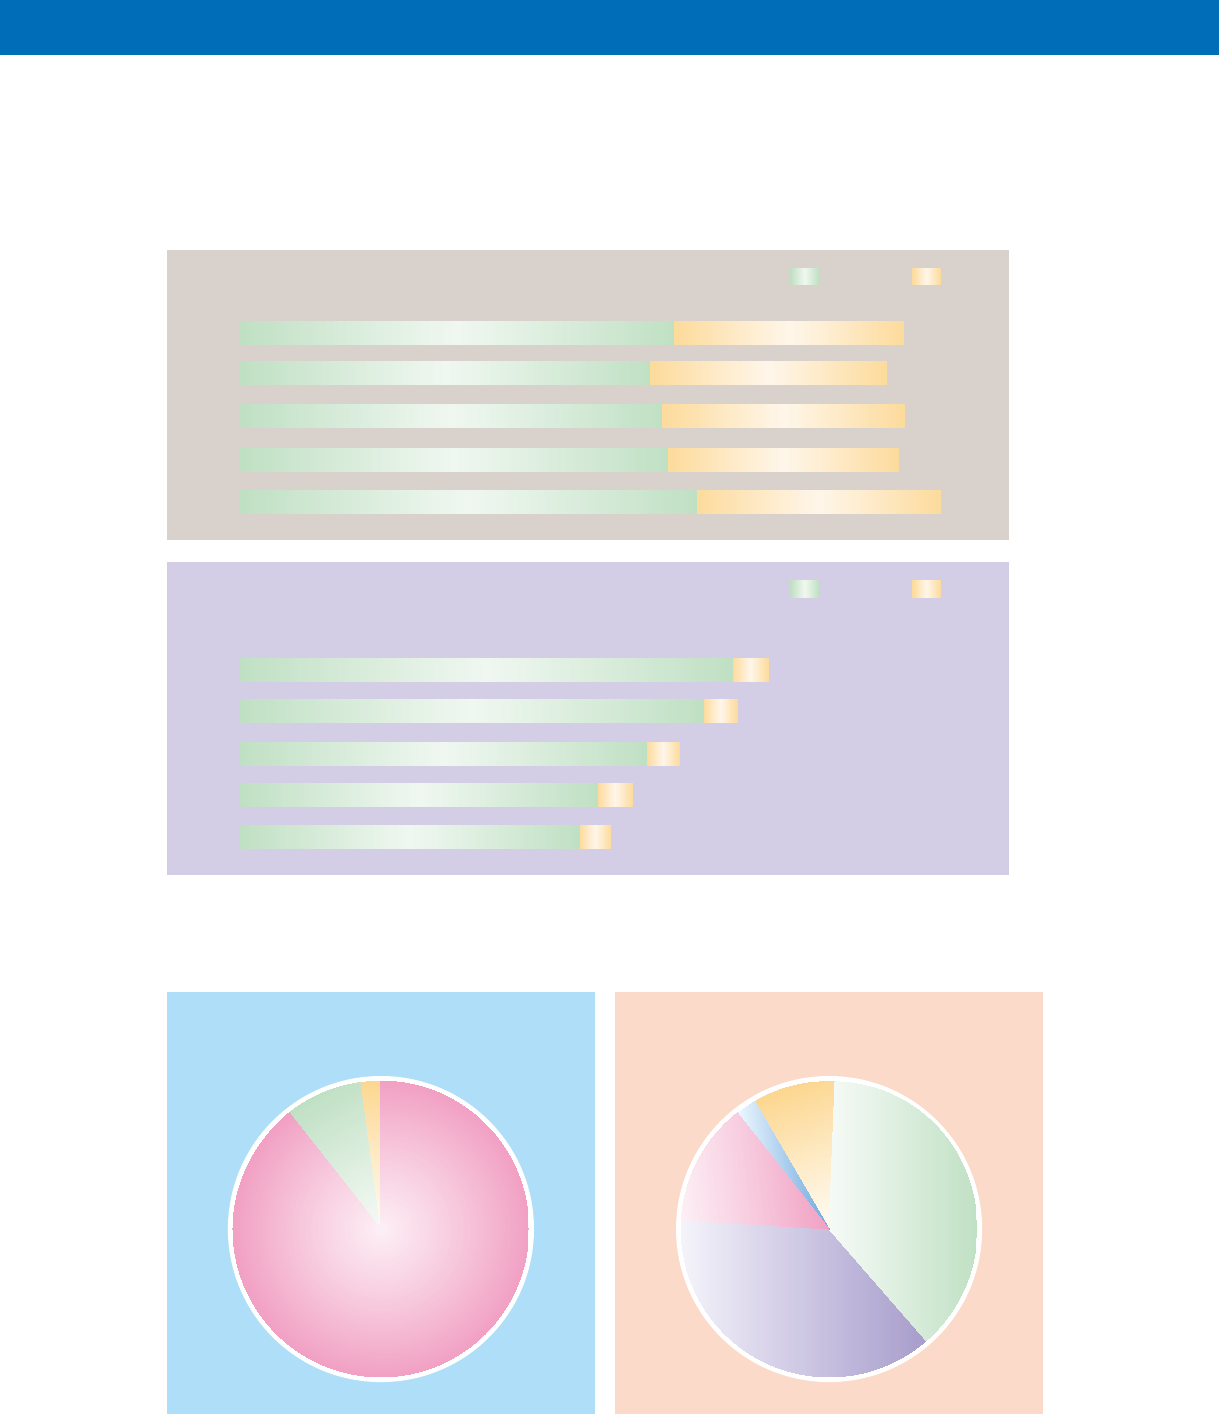
2015 Net Sales By Products
2015 Net Sales By Market
(Year ended 31 March, 2015 Millions of yen) (Year ended 31 March, 2015 Millions of yen)
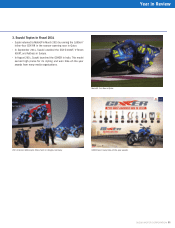
Automobile Production
Years ended 31 March (Thousand units)
Overseas Japan
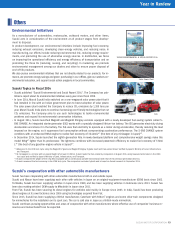
Motorcycle Production
Years ended 31 March (Thousand units)
(ATV included)
2013
Overseas Japan
Total
Total
Automobile
2,701,942
89.6%
2013
1,782 1,020 2,802
2011
2012
1,884 994 2,878
2011
2012
2,550 185 2,735
2014
1,834 1,044 2,878
2014
2,100 169 2,269
2015
1,859 998 2,857
1,988 1,055 3,043
2015 1,645 154 1,799
1,852 180 2,033
Japan
1,094,611
36.3%
Others
268,325
8.9%
North
America
65,976
2.2%
Europe
372,028
12.3%
Asia
1,214,519
40.3%
2,400 174 2,574
Motorcycle
250,485
8.3%
Marine & Power
Products, etc.
63,033
2.1%
n Production
n 2015 Net Sales