Suzuki 2015 Annual Report Download - page 33
Download and view the complete annual report
Please find page 33 of the 2015 Suzuki annual report below. You can navigate through the pages in the report by either clicking on the pages listed below, or by using the keyword search tool below to find specific information within the annual report.-
 1
1 -
2
-
3
-
4
-
5
-
6
-
7
-
8
-
9
-
10
-
11
-
12
-
13
-
14
-
15
-
16
-
17
-
18
-
19
-
20
-
21
-
22
-
 23
23 -
 24
24 -
 25
25 -
 26
26 -
 27
27 -
 28
28 -
 29
29 -
 30
30 -
 31
31 -
 32
32 -
 33
33 -
 34
34 -
 35
35 -
 36
36 -
 37
37 -
 38
38 -
 39
39 -
 40
40 -
 41
41 -
 42
42 -
 43
43 -
44
-
45
-
46
-
47
-
48
-
49
-
50
-
51
-
52
-
53
-
54
-
55
-
56
-
57
-
58
-
59
-
60
-
61
-
62
-
63
-
64
-
65
-
66
-
67
-
68
-
69
-
70
-
71
-
72
 |
 |

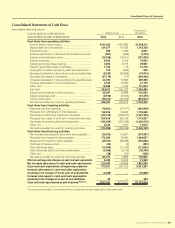
Management Discussion and Analysis
SUZUKI MOTOR CORPORATION 31
Management Discussion and Analysis
SUZUKI MOTOR CORPORATION 31
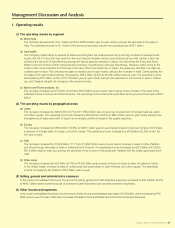
1. Operating results
(1) The operating results by segment
(a) Motorcycle
The net sales decreased by ¥16.1 billion (6.0%) to ¥250.5 billion year-on-year mainly owing to the decrease in the sales in
Asia. The operating income of ¥0.1 billion in the previous scal year became an operating loss of ¥0.7 billion.
(b) Automobile
The Company made efforts to expand its sales and strengthen the products such as by winning numbers of awards includ-
ing the 2015 RJC Car of the Year award for the much-favored Hustler minicar, launching the all-new Alto minicar, which has
achieved the top level of fuel efciency among non-hybrid gasoline vehicles in Japan, and launching the Every and Every
Wagon one-box minicars which have pursued roominess, fuel efciency, and user-friendliness. However, partly owing to the
impact of the recoil reduction from the hike in the rate of the consumption tax in Japan, the Japanese domestic net sales de-
creased year-on-year. The overseas net sales increased year-on-year mainly owing to the increase in India. Consequently, the
net sales of the automobile business increased by ¥86.3 billion (3.3%) to ¥2,702.0 billion year-on-year. The operating income
decreased by ¥7.5 billion (4.2%) to ¥171.8 billion year-on-year mainly owing to the decrease in the income in Japan, Indone-
sia, and Thailand, despite the increase in the income in India.
(c) Marine and Power products, etc.
The net sales increased by ¥7.0 billion (12.5%) to ¥63.0 billion year-on-year mainly owing to the increase in the sales of the
outboard motors in Europe and North America. The operating income was at the same level as the previous scal year at ¥8.3
billion.
(2) The operating results by geographical areas
(a) Japan
The net sales increased by ¥63.3 billion (3.7%) to ¥1,765.0 billion year-on-year due to expansion of triangle trade via Japan
and other causes. The operating income decreased by ¥43.8 billion (32.6%) to ¥90.7 billion year-on-year mainly owing to the
strengthening of sales promotion of Japan and overseas and the increase in the quality expenses.
(b) Europe
The net sales increased by ¥59.6 billion (15.9%) to ¥436.1 billion year-on-year owing to launch of all-new compact SUV Vitara,
expansion of triangle trade via Japan, and other causes. The operating income increased by ¥0.9 billion (23.2%) to ¥5.1 bil-
lion year-on-year.
(c) Asia
The net sales increased by ¥130.8 billion (11.1%) to ¥1,306.2 billion year-on-year due to increase of sales in India, Pakistan
and others though decrease of sales in Indonesia and Thailand. The operating income increased by ¥22.2 billion (37.3%) to
¥81.6 billion year-on-year, by covering the decrease in the income in Indonesia and Thailand with the Indian automobile busi-
ness.
(d) Other areas
The net sales increased by ¥8.2 billion (5.4%) to ¥159.2 billion year-on-year owing to increase of sales of outboard motors
in the United States, increase of sales of motorcycles and automobiles in Latin America, and other causes. The operating
income increased by ¥2.4 billion to ¥2.6 billion year-on-year.
(3) Selling, general and administrative expenses
In the current consolidated scal year, the amount of selling, general and administrative expenses increased by ¥37.9 billion (6.2%)
to ¥645.7 billion year-on-year because of increase of sales expenses such as sales promotion expenses.
(4) Other income and expenses
In the current consolidated scal year, the net amount of other income and expenses was a gain of ¥13.8 billion, which increased by ¥4.5
billion year-on-year. This was mainly due to increase of Interest income and dividends income from the previous scal year.