Suzuki 2015 Annual Report Download - page 35
Download and view the complete annual report
Please find page 35 of the 2015 Suzuki annual report below. You can navigate through the pages in the report by either clicking on the pages listed below, or by using the keyword search tool below to find specific information within the annual report.-
 1
1 -
2
-
3
-
4
-
5
-
6
-
7
-
8
-
9
-
10
-
11
-
12
-
13
-
14
-
15
-
16
-
17
-
18
-
19
-
20
-
21
-
22
-
23
-
24
-
 25
25 -
 26
26 -
 27
27 -
 28
28 -
 29
29 -
 30
30 -
 31
31 -
 32
32 -
 33
33 -
 34
34 -
 35
35 -
 36
36 -
 37
37 -
 38
38 -
 39
39 -
 40
40 -
 41
41 -
 42
42 -
 43
43 -
 44
44 -
 45
45 -
46
-
47
-
48
-
49
-
50
-
51
-
52
-
53
-
54
-
55
-
56
-
57
-
58
-
59
-
60
-
61
-
62
-
63
-
64
-
65
-
66
-
67
-
68
-
69
-
70
-
71
-
72
 |
 |

SUZUKI MOTOR CORPORATION 33
SUZUKI MOTOR CORPORATION
CONSOLIDATED
Millions of yen
(except per share amounts)
Thousands of
US dollars
(except per
share amounts)
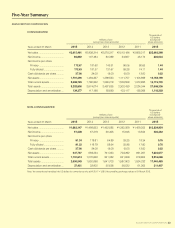
Years ended 31 March 2015 2014 2013 2012 2011 2015
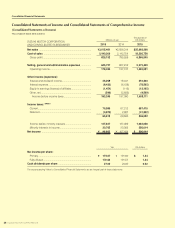
Net sales ...................................... ¥3,015,461 ¥2,938,314 ¥2,578,317 ¥2,512,186 ¥2,608,217 $25,093,298
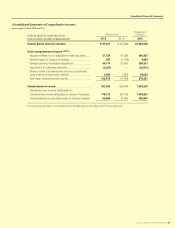
Net income................................... 96,862 107,484 80,389 53,887 45,174 806,044
Net income per share:
Primary ..................................... 172.67 191.60 143.31 96.06 80.65 1.44
Fully diluted .............................. 172.63 191.57 131.67 88.28 74.11 1.44
Cash dividends per share ........... 27.00 24.00 18.00 15.00 13.00 0.22
Net assets .................................... 1,701,390 1,494,357 1,298,553 1,111,757 1,106,999 14,158,199
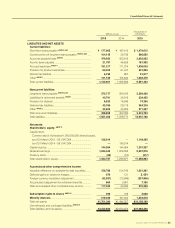
Total current assets ...................... 2,008,729 1,790,832 1,560,218 1,509,568 1,372,885 16,715,730
Total assets .................................. 3,252,800 2,874,074 2,487,635 2,302,439 2,224,344 27,068,326
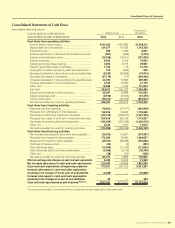
Depreciation and amortization .... 134,377 117,188 93,680 103,117 138,368 1,118,228
NON-CONSOLIDATED
Millions of yen
(except per share amounts)
Thousands of
US dollars
(except per
share amounts)
Years ended 31 March 2015 2014 2013 2012 2011 2015
Net sales ...................................... ¥1,663,147 ¥1,498,853 ¥1,422,595 ¥1,383,269 ¥1,409,205 $13,839,954
Net income................................... 51,248 67,219 36,405 15,846 10,834 426,463
Net income per share:
Primary ..................................... 91.34 119.81 64.89 28.25 19.34 0.76
Fully diluted .............................. 91.32 119.79 59.64 25.98 17.80 0.76
Cash dividends per share ........... 27.00 24.00 18.00 15.00 13.00 0.22
Net assets .................................... 937,767 859,224 761,353 703,292 691,207 7,803,677
Total current assets ...................... 1,191,614 1,070,668 921,352 921,669 818,964 9,916,069
Total assets .................................. 2,096,545 1,850,068 1,641,700 1,597,903 1,524,232 17,446,495
Depreciation and amortization .... 37,421 33,605 35,626 38,532 61,265 311,407
Note: Yen amounts ar e translated into US dollars for convenience only, at ¥120.17 = US$1, the prevailing exchange rate as of 31 March 2015.
Five-Year Summary
SUZUKI MOTOR CORPORATION 33