Suzuki 2015 Annual Report Download - page 65
Download and view the complete annual report
Please find page 65 of the 2015 Suzuki annual report below. You can navigate through the pages in the report by either clicking on the pages listed below, or by using the keyword search tool below to find specific information within the annual report.-
 1
1 -
2
-
3
-
4
-
5
-
6
-
7
-
8
-
9
-
10
-
11
-
12
-
13
-
14
-
15
-
16
-
17
-
18
-
19
-
20
-
21
-
22
-
23
-
24
-
25
-
26
-
27
-
28
-
29
-
30
-
31
-
32
-
33
-
34
-
35
-
36
-
37
-
38
-
39
-
40
-
41
-
42
-
43
-
44
-
45
-
46
-
47
-
48
-
49
-
50
-
51
-
52
-
53
-
54
-
 55
55 -
 56
56 -
 57
57 -
 58
58 -
 59
59 -
 60
60 -
 61
61 -
 62
62 -
 63
63 -
 64
64 -
 65
65 -
 66
66 -
 67
67 -
 68
68 -
 69
69 -
 70
70 -
 71
71 -
 72
72
 |
 |

Consolidated Financial Statements
SUZUKI MOTOR CORPORATION 63
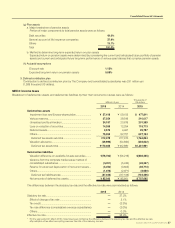
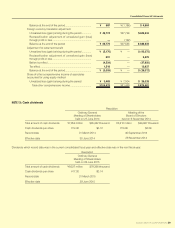
(Reference information)
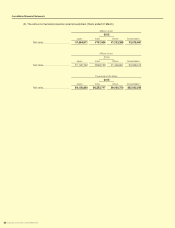
As reference information, operating results by geographical areas were as follows:
(a) The amount of net sales, operating income or loss based on location of
The Company and its consolidated subsidiaries (Years ended 31 March)
Millions of yen
2015
Japan Europe Asia
Other
areas Eliminations Consolidated
Net Sales:
Net sales to external customers ...
¥1,317,659
¥306,156 ¥1,233,494 ¥158,151 ¥ —
¥3,015,461
Internal net sales or transfer
among geographical areas ..........
447,311
129,982 72,736 1,029 (651,059) —
Total
1,764,970
436,139 1,306,230 159,181 (651,059)
3,015,461
Operating income .............................
90,718 5,116 81,607 2,620 (637
)
179,424
Millions of yen
2014
Japan Europe Asia
Other
areas Eliminations Consolidated
Net Sales:
Net sales to external customers ...
¥1,309,383
¥ 360,465 ¥1,118,169 ¥ 150,296 ¥ —
¥2,938,314
Internal net sales or transfer
among geographical areas ..........
392,284
16,000 57,185 679 (466,149)
—
Total
1,701,667
376,466 1,175,355 150,975 (466,149)
2,938,314
Operating income .............................
134,513 4,154 59,419 241 (10,582
)
187,747
Thousands of US dollars
2015
Japan Europe Asia
Other
areas Eliminations Consolidated
Net sales:
Net sales to external customers ...
$10,964,960
$2,547,693
$10,264,578
$1,316,066 $ —
$25,093,298
Internal net sales or transfer
among geographical areas ..........
3,722,322
1,081,657
605,276
8,566 (5,417,822) —
Total
14,687,283
3,629,350
10,869,854
1,324,632 (5,417,822)
25,093,298
Operating income .............................
754,915
42,573
679,102
21,802 (5,302)
1,493,091
* “Other areas” consists principally of North America, Oceania and South America.