Suzuki 2015 Annual Report Download - page 59
Download and view the complete annual report
Please find page 59 of the 2015 Suzuki annual report below. You can navigate through the pages in the report by either clicking on the pages listed below, or by using the keyword search tool below to find specific information within the annual report.-
 1
1 -
2
-
3
-
4
-
5
-
6
-
7
-
8
-
9
-
10
-
11
-
12
-
13
-
14
-
15
-
16
-
17
-
18
-
19
-
20
-
21
-
22
-
23
-
24
-
25
-
26
-
27
-
28
-
29
-
30
-
31
-
32
-
33
-
34
-
35
-
36
-
37
-
38
-
39
-
40
-
41
-
42
-
43
-
44
-
45
-
46
-
47
-
48
-
 49
49 -
 50
50 -
 51
51 -
 52
52 -
 53
53 -
 54
54 -
 55
55 -
 56
56 -
 57
57 -
 58
58 -
 59
59 -
 60
60 -
 61
61 -
 62
62 -
 63
63 -
 64
64 -
 65
65 -
 66
66 -
 67
67 -
 68
68 -
 69
69 -
70
-
71
-
72
 |
 |

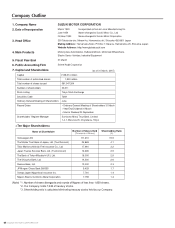
Consolidated Financial Statements
SUZUKI MOTOR CORPORATION 57
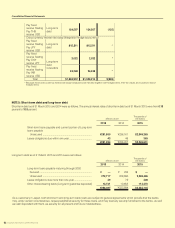
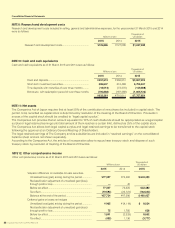
NOTE 8: Income taxes
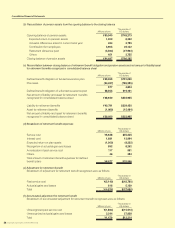
Breakdown of deferred tax assets and deferred tax liabilities by their main occurrence causes were as follows:
Millions of yen
Thousands of
US dollars
2015 2014 2015
Deferred tax assets
Impairment loss and Excess-depreciation ....................... ¥ 57,418 ¥ 59,105 $ 477,811
Various reserves ................................................................. 37,254 39,548 310,017
Unrealized prots elimination ............................................ 24,197 20,876 201,359
Loss on valuation of securities .......................................... 14,265 12,254 118,713
Deferred assets ................................................................. 3,579 3,367 29,787
Others ................................................................................. 75,362 82,757 627,134
Deferred tax assets sub-total .......................................... 212,078 217,910 1,764,824
Valuation allowance ........................................................... (39,996)(54,930)(332,832)
Deferred tax assets total ................................................. ¥172,082 ¥162,980 $1,431,991
Deferred tax liabilities
Valuation difference on available-for-sale securities ........ ¥(76,700)¥ (56,219)$(638,265)
Variance from the complete market value method of
consolidated subsidiaries ................................................. (5,811)(5,243)(48,357)
Reserve for advanced depreciation of noncurrent assets
... (3,450)(3,603)(28,713)
Others ................................................................................. (1,076)(2,071)(8,959)
Deferred tax liabilities total .............................................. (87,038)(67,138)(724,296)
Net amounts of deferred tax assets .................................. ¥ 85,043 ¥ 95,841 $ 707,695
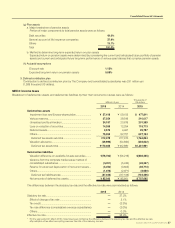
The differences between the statutory tax rate and the effective tax rate were summarized as follows:
2015 2014
Statutory tax rate .................................................................... —37.2%
Effect of change of tax rate ............................................... —3.1%
Tax credit ............................................................................ —(3.3%)
Tax rate difference (consolidated overseas subsidiaries) —(2.0%)
Others ................................................................................. —0.3%
Effective tax rate .................................................................... —35.3%
* For the year ended 31 March 2015, notes have been omitted as the difference between the statutory tax rate and the effective tax rate
after adoption of tax effect accounting was less than 5% of the statutory tax rate.
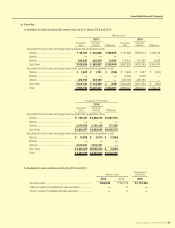
(g) Plan assets
a. Major breakdown of pension assets
Portion of major components to total pension assets were as follows:
Debt securities 49.0%
General account of life insurance companies 37.9%
Others 13.1%
Total 100.0%
b. Method to determine long-term expected return on plan assets
Expected return on pension assets were determined by considering the current and anticipated future portfolio of pension
assets and current and anticipated future long-term performance of various asset classes that comprise pension assets.
(h) Actuarial assumptions
Discount rate 1.12%
Expected long-term return on pension assets 0.88%
3.Denedcontributionplan
Contribution to dened contribution plan by The Company and consolidated subsidiaries was 231 million yen
(1,926 thousand US dollars).