Suzuki 2015 Annual Report Download - page 41
Download and view the complete annual report
Please find page 41 of the 2015 Suzuki annual report below. You can navigate through the pages in the report by either clicking on the pages listed below, or by using the keyword search tool below to find specific information within the annual report.-
 1
1 -
2
-
3
-
4
-
5
-
6
-
7
-
8
-
9
-
10
-
11
-
12
-
13
-
14
-
15
-
16
-
17
-
18
-
19
-
20
-
21
-
22
-
23
-
24
-
25
-
26
-
27
-
28
-
29
-
30
-
 31
31 -
 32
32 -
 33
33 -
 34
34 -
 35
35 -
 36
36 -
 37
37 -
 38
38 -
 39
39 -
 40
40 -
 41
41 -
 42
42 -
 43
43 -
 44
44 -
 45
45 -
 46
46 -
 47
47 -
 48
48 -
 49
49 -
 50
50 -
 51
51 -
52
-
53
-
54
-
55
-
56
-
57
-
58
-
59
-
60
-
61
-
62
-
63
-
64
-
65
-
66
-
67
-
68
-
69
-
70
-
71
-
72
 |
 |

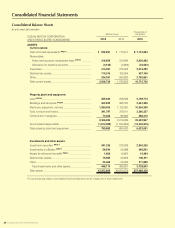
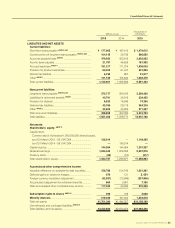
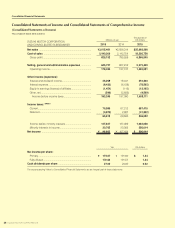
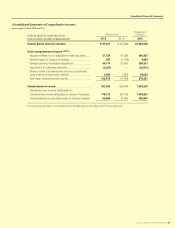
Consolidated Financial Statements
SUZUKI MOTOR CORPORATION 39
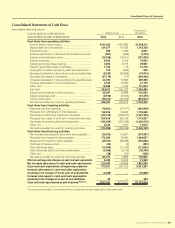
Consolidated Statements of Cash Flows
Years ended 31 March 2015 and 2014
SUZUKI MOTOR CORPORATION
AND CONSOLIDATED SUBSIDIARIES
Millions of yen
Thousands of
US dollars
2015 2014 2015
Cashowsfromoperatingactivities
Income before income taxes ............................................. ¥193,246 ¥197,090 $1,608,111
Depreciation and amortization .......................................... 134,377 117,188 1,118,228
Impairment loss ................................................................. 969 1,029 8,067
Increase (decrease) in allowance for doubtful accounts (867) (699)(7,216)
Interest and dividends income .......................................... (25,259)(18,441)(210,200)
Interest expenses .............................................................. 9,433 6,158 78,505
Foreign exchange losses (gains) ...................................... 4,804 6,718 39,981
Equity in (ear nings) losses of afliates .............................. 1,454 115 12,105
Loss (gain) on sales of property, plant and equipment ... 102 (290)850
Decrease (increase) in notes and accounts receivable-trade
(9,242)(49,559)(76,914)
Decrease (increase) in inventories ................................... (37,179)(10)(309,392)
Increase (decrease) in notes and accounts payable-trade
44,390 72,664 369,398
Increase (decrease) in accrued expenses ...................... 2,542 12,680 21,155
Other, net ............................................................................ 15,838 7,126 131,804
Sub-total 334,611 351,772 2,784,485
Interest and dividends income received .......................... 25,347 18,999 210,933
Interest expenses paid ...................................................... (8,108)(5,646)(67,475)
Income taxes paid ............................................................. (96,813)(42,209)(805,640)
Net cash provided by (used in) operating activities 255,037 322,915 2,122,302
Cashowsfrominvestingactivities
Payments into time deposits ............................................. (79,661)(77,477)(662,905)
Proceeds from withdrawal of time deposits...................... 136,236 38,842 1,133,695
Purchases of short-term investment securities ................ (193,152)(209,912)(1,607,325)
Proceeds from sales of short-term investment securities
206,239 165,156 1,716,227
Purchases of property, plant and equipment ................... (192,694)(204,739)(1,603,516)
Other, net ............................................................................ 2,123 1,570 17,674
Net cash provided by (used in) investing activities (120,909)(286,559)(1,006,149)
Cashowsfromnancingactivities
Net increase (decrease) in short-term loans payable ...... (26,353)24,691 (219,297)
Proceeds from long-term loans payable .......................... 173,000 30,000 1,439,627
Repayment of long-term loans payable ........................... (45,191)(38,488)(376,066)
Purchase of treasury stock ................................................ (30)(5)(252)
Cash dividends paid ......................................................... (13,466)(11,219)(112,062)
Cash dividends paid to minority shareholders ................. (3,456)(2,133)(28,765)
Other, net ............................................................................ (28)(35)(236)
Net cash provided by (used in) nancing activities 84,472 2,809 702,945
Effect of exchange rate changes on cash and cash equivalents
5,042 10,342 41,962
Net increase (decrease) in cash and cash equivalents 223,643 49,508 1,861,060
Cash and cash equivalents at beginning of period 710,611 661,102 5,913,381
Increase (decrease) in cash and cash equivalents
resultingfromchangeofscalyearofsubsidiaries (2,039)—(16,969)
Increase (decrease) in cash and cash equivalents
resulting from change of scope of consolidation 45 —382
Cash and cash equivalents at end of period *NOTE 10 ¥932,261 ¥710,611 $7,757,854
The accompanying Notes to Consolidated Financial Statements are an integral part of these statements.