Suzuki 2015 Annual Report Download - page 49
Download and view the complete annual report
Please find page 49 of the 2015 Suzuki annual report below. You can navigate through the pages in the report by either clicking on the pages listed below, or by using the keyword search tool below to find specific information within the annual report.-
 1
1 -
2
-
3
-
4
-
5
-
6
-
7
-
8
-
9
-
10
-
11
-
12
-
13
-
14
-
15
-
16
-
17
-
18
-
19
-
20
-
21
-
22
-
23
-
24
-
25
-
26
-
27
-
28
-
29
-
30
-
31
-
32
-
33
-
34
-
35
-
36
-
37
-
38
-
 39
39 -
 40
40 -
 41
41 -
 42
42 -
 43
43 -
 44
44 -
 45
45 -
 46
46 -
 47
47 -
 48
48 -
 49
49 -
 50
50 -
 51
51 -
 52
52 -
 53
53 -
 54
54 -
 55
55 -
 56
56 -
 57
57 -
 58
58 -
 59
59 -
60
-
61
-
62
-
63
-
64
-
65
-
66
-
67
-
68
-
69
-
70
-
71
-
72
 |
 |
Consolidated Financial Statements
SUZUKI MOTOR CORPORATION 47
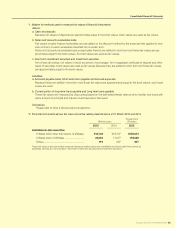
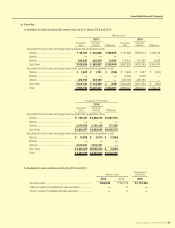
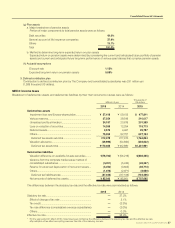
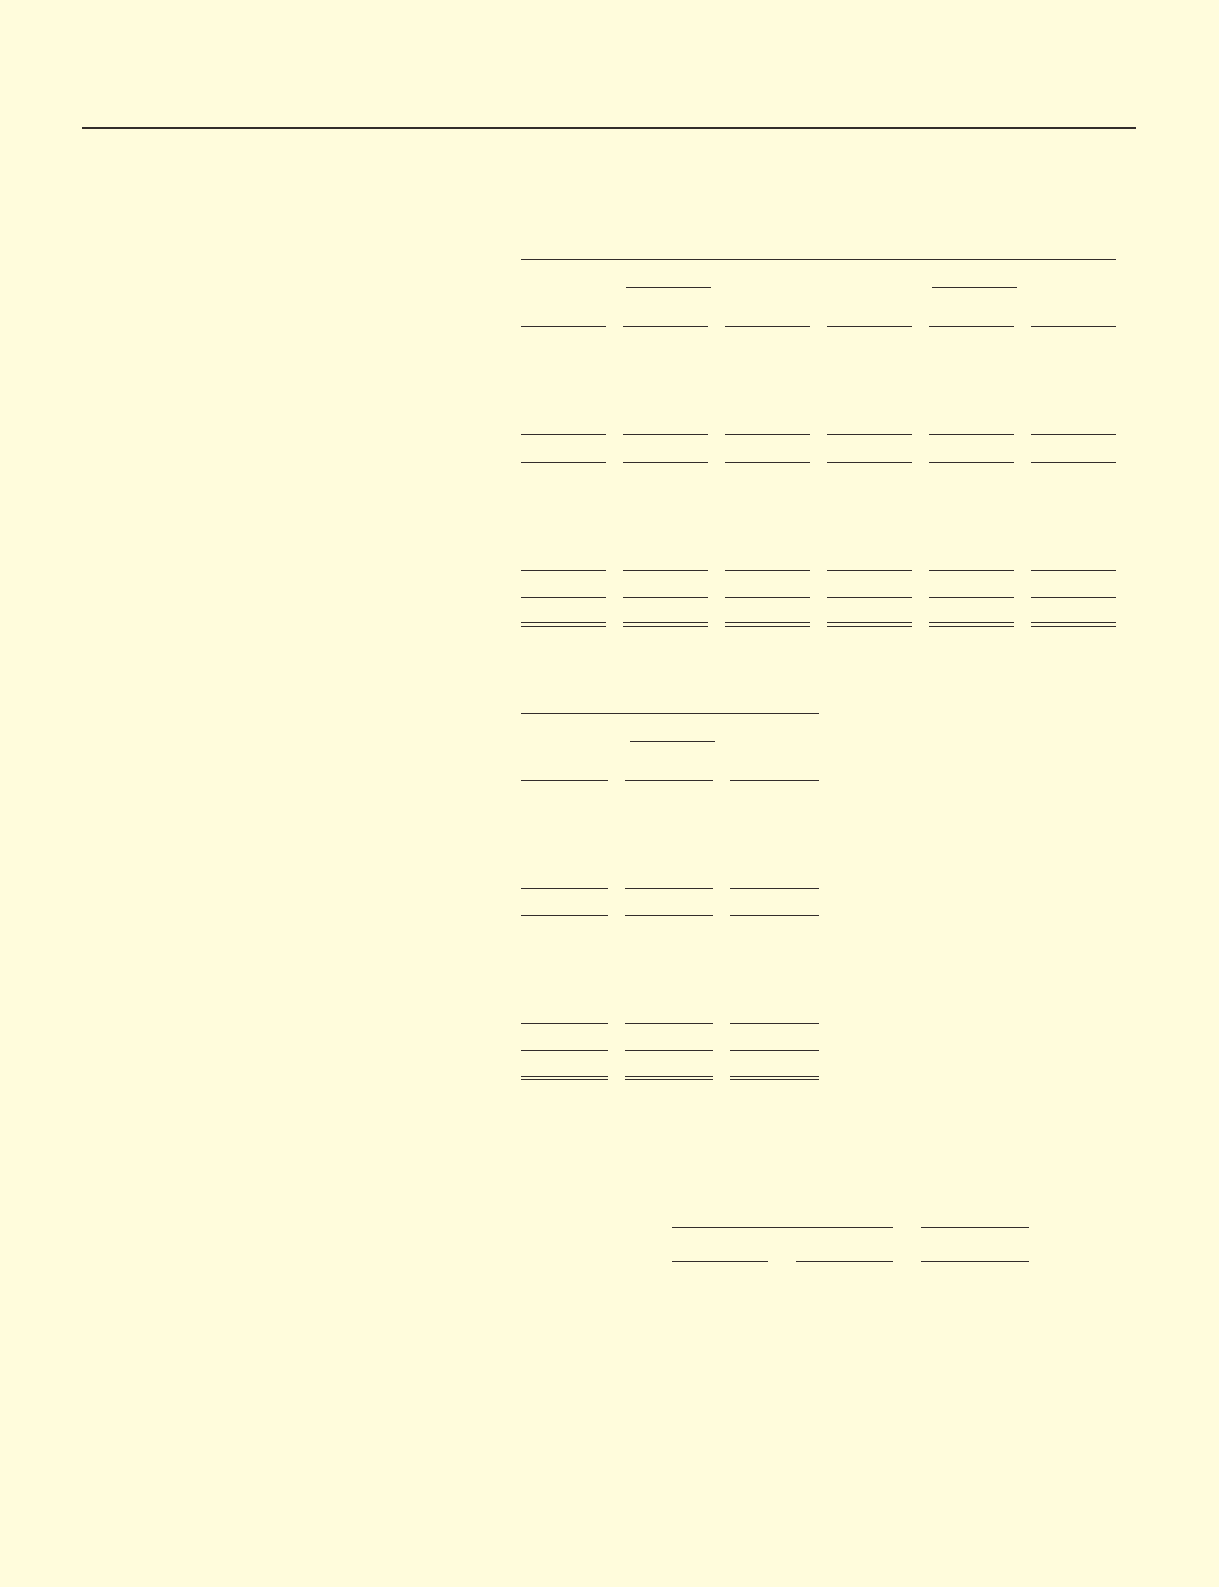
(c) Securities
a. Available-for-sale securities with market value as of 31 March 2015 and 2014
Millions of yen
2015 2014
Acquisition
cost
Carrying
Amount Difference
Acquisition
cost
Carrying
Amount Difference
Securities for which the carrying amount exceeds the acquisition costs
Stocks .................................................... ¥ 93,769 ¥ 320,628 ¥ 226,859 ¥ 91,865 ¥250,014 ¥158,148
Bonds .................................................... ——————
Others .................................................... 249,238 263,329 14,090 175,441 181,767 6,325
Sub-Total ¥343,008 ¥ 583,957 ¥ 240,949 ¥267,307 ¥431,782 ¥164,474
Securities for which the carrying amount does not exceed the acquisition costs
Stocks .................................................... ¥ 1,549 ¥ 1,191 ¥ (358)¥ 1,928 ¥ 1,567 ¥ (361)
Bonds .................................................... ———5,000 5,000 —
Others .................................................... 422,198 422,198 —425,164 425,164 —
Sub-Total ¥423,748 ¥ 423,389 ¥ (358)¥432,093 ¥431,732 ¥ (361)
Total ¥766,756
¥1,007,347
¥ 240,591 ¥699,401 ¥863,514 ¥164,113
Thousands of US dollars
2015
Acquisition
cost
Carrying
Amount Difference
Securities for which the carrying amount exceeds the acquisition costs
Stocks ....................................................
$ 780,304
$ 2,668,124
$1,887,819
Bonds .................................................... — — —
Others .................................................... 2,074,052 2,191,308 117,255
Sub-Total
$ 2,854,357 $ 4,859,432
$2,005,075
Securities for which the carrying amount does not exceed the acquisition costs
Stocks .................................................... $ 12,898 $ 9,913 $ (2,984)
Bonds .................................................... — — —
Others .................................................... 3,513,341 3,513,341 —
Sub-Total
$ 3,526,239
$3,523,254 $ (2,984)
Total
$ 6,380,596 $ 8,382,687
$2,002,090
b. Available-for-sale securities sold during 2015 and 2014
Millions of yen
Thousands of
US dollars
2015 2014 2015
Amounts sold ..................................................................... ¥206,255 ¥165,779 $1,716,364
Gains on sales of available-for-sale securities ................. —17 —
Loss on sales of available-for-sale securities .................. —0—