Suzuki 2015 Annual Report Download - page 46
Download and view the complete annual report
Please find page 46 of the 2015 Suzuki annual report below. You can navigate through the pages in the report by either clicking on the pages listed below, or by using the keyword search tool below to find specific information within the annual report.-
 1
1 -
2
-
3
-
4
-
5
-
6
-
7
-
8
-
9
-
10
-
11
-
12
-
13
-
14
-
15
-
16
-
17
-
18
-
19
-
20
-
21
-
22
-
23
-
24
-
25
-
26
-
27
-
28
-
29
-
30
-
31
-
32
-
33
-
34
-
35
-
 36
36 -
 37
37 -
 38
38 -
 39
39 -
 40
40 -
 41
41 -
 42
42 -
 43
43 -
 44
44 -
 45
45 -
 46
46 -
 47
47 -
 48
48 -
 49
49 -
 50
50 -
 51
51 -
 52
52 -
 53
53 -
 54
54 -
 55
55 -
 56
56 -
57
-
58
-
59
-
60
-
61
-
62
-
63
-
64
-
65
-
66
-
67
-
68
-
69
-
70
-
71
-
72
 |
 |

44 SUZUKI MOTOR CORPORATION
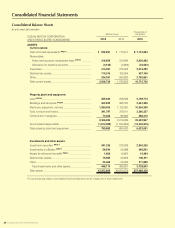
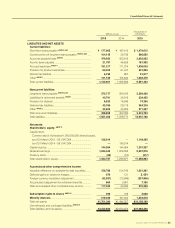
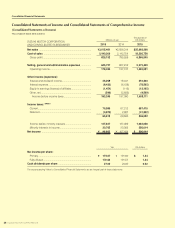
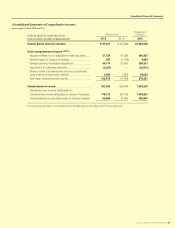
Consolidated Financial Statements
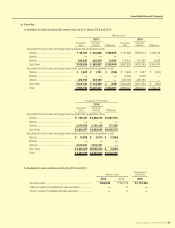
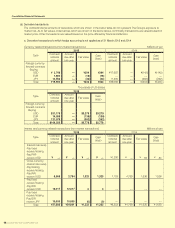
(b) Mattersforfairvaluesofthenancialinstruments
Carrying amounts in the consolidated balance sheet, fair values and difference as of 31 March 2015 and 2014 were as fol-
lows. Financial instruments whose fair value cannot be reliably determined are not included in the below table.
Millions of yen
2015 2014
Carrying
amount Fair value Difference Carrying
amount Fair value Difference
Cash and deposits ¥457,513 ¥457,513 ¥ — ¥358,851 ¥358,851 ¥ —
Notes and accounts receivables-trade 316,826 318,567 1,741 310,694 311,221 527
Short-term investment securities and
Investment securities
Available-for-sale securities
Investments in afliates
1,007,347
616 1,007,347
669 —
52 863,514
513
863,514
252
—
(261)
Total of assets 1,782,304 1,784,098 1,794 1,533,573 1,533,838 265
Accounts payable-trade 479,950 479,950 —433,819 433,819 —
Short-term loans payable 177,805 177,805 —197,413 197,413 —
Current portion of long-term loans payable
104,145 103,768 377 38,748 38,779 (31)
Accrued expenses
181,217 181,217 —171,274 171,274 —
Long-term loans payable 272,717 268,346 4,370 209,166 207,874 1,291
Total of liabilities 1,215,834 1,211,087 4,747 1,050,421 1,049,160 1,260
Derivatives
Hedge accounting is applied
Hedge accounting is not applied
1,072
1,603 1,072
1,603 —
—51
1,160
51
1,160
—
—
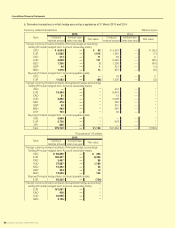
Thousands of US dollars
2015
Carrying
amount Fair value Difference
Cash and deposits $3,807,223 $3,807,223 $ —
Notes and accounts receivables-trade 2,636,483 2,650,976 14,492
Short-term investment securities and
Investment securities
Available-for-sale securities
Investments in afliates
8,382,687
5,131 8,382,687
5,572 —
440
Total of assets 14,831,524 14,846,458 14,933
Accounts payable-trade 3,993,925 3,993,925 —
Short-term loans payable 1,479,615 1,479,615 —
Current portion of long-term loans payable
866,650 863,511 3,139
Accrued expenses
1,508,005 1,508,005 —
Long-term loans payable 2,269,426 2,233,061 36,365
Total of liabilities 10,117,623 10,078,119 39,504
Derivatives
Hedge accounting is applied
Hedge accounting is not applied
8,922
13,339 8,922
13,339 —
—
* Assets or liabilities derived from derivatives are shown on a net basis and net liabilities are shown as ( ).