Suzuki 2014 Annual Report Download - page 7
Download and view the complete annual report
Please find page 7 of the 2014 Suzuki annual report below. You can navigate through the pages in the report by either clicking on the pages listed below, or by using the keyword search tool below to find specific information within the annual report.-
 1
1 -
 2
2 -
 3
3 -
 4
4 -
 5
5 -
 6
6 -
 7
7 -
 8
8 -
 9
9 -
 10
10 -
 11
11 -
 12
12 -
 13
13 -
 14
14 -
 15
15 -
 16
16 -
 17
17 -
 18
18 -
19
-
20
-
21
-
22
-
23
-
24
-
25
-
26
-
27
-
28
-
29
-
30
-
31
-
32
-
33
-
34
-
35
-
36
-
37
-
38
-
39
-
40
-
41
-
42
-
43
-
44
-
45
-
46
-
47
-
48
-
49
-
50
-
51
-
52
-
53
-
54
-
55
-
56
-
57
-
58
-
59
-
60
-
61
-
62
-
63
-
64
-
65
-
66
-
67
-
68
-
69
-
70
 |
 |

SUZUKI MOTOR CORPORATION 5
Year in Review
Year in Review
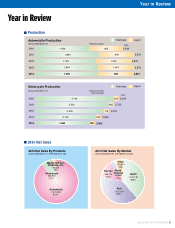
2014 Net Sales By Products
2014 Net Sales By Market
(Year ended March 31, 2014 Millions of yen) (Year ended March 31, 2014 Millions of yen)
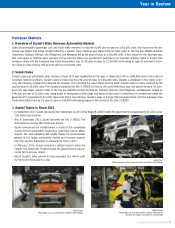
Automobile Production
Years ended March 31 (Thousand units)
Overseas Japan
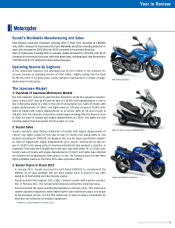
Motorcycle Production
Years ended March 31 (Thousand units)
(ATV included)
2012 2,400 174 2,574
Overseas Japan
Total
Total
Automobile
2,615,664
89.0%
Marine & Power
Products, etc.
56,046
1.9%
Motorcycle
266,602
9.1%
2012 1,782 1,020 2,802
2010 1,586 959 2,545
2011 1,884 994 2,878
2010 2,743 162 2,904
2011 2,550 185 2,735
2013 1,834 1,044 2,878
2013 2,100 169 2,269
2014 1,859 998 2,857
2014 1,882 180 2,063
Japan
1,132,732
38.6%
Other
193,941
6.6%
North
America
64,890
2.2%
Europe
394,714
13.4%
Asia
1,152,034
39.2%
n Production
n 2014 Net Sales