Suzuki 2014 Annual Report Download - page 44
Download and view the complete annual report
Please find page 44 of the 2014 Suzuki annual report below. You can navigate through the pages in the report by either clicking on the pages listed below, or by using the keyword search tool below to find specific information within the annual report.-
 1
1 -
2
-
3
-
4
-
5
-
6
-
7
-
8
-
9
-
10
-
11
-
12
-
13
-
14
-
15
-
16
-
17
-
18
-
19
-
20
-
21
-
22
-
23
-
24
-
25
-
26
-
27
-
28
-
29
-
30
-
31
-
32
-
33
-
 34
34 -
 35
35 -
 36
36 -
 37
37 -
 38
38 -
 39
39 -
 40
40 -
 41
41 -
 42
42 -
 43
43 -
 44
44 -
 45
45 -
 46
46 -
 47
47 -
 48
48 -
 49
49 -
 50
50 -
 51
51 -
 52
52 -
 53
53 -
 54
54 -
55
-
56
-
57
-
58
-
59
-
60
-
61
-
62
-
63
-
64
-
65
-
66
-
67
-
68
-
69
-
70
 |
 |

42 SUZUKI MOTOR CORPORATION
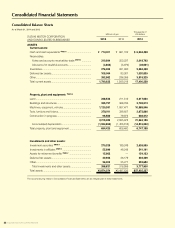
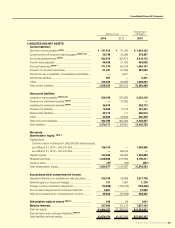
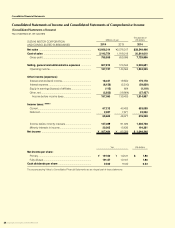
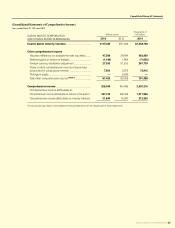
Consolidated Financial Statements
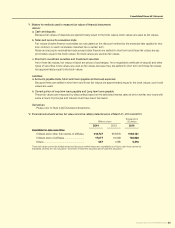
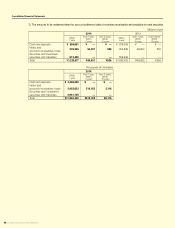
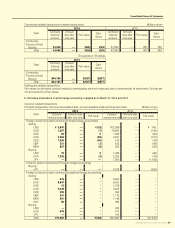
(b) Mattersforfairvaluesofthenancialinstruments
Carrying amounts in the consolidated balance sheet, fair values and difference as of March 31, 2014 and 2013 were as fol-
lows. Financial instruments whose fair value cannot be reliably determined are not included in the below table.
Millions of yen
2014 2013
Carrying
amount Fair value Difference Carrying
amount Fair value Difference
Cash and deposits ¥358,851 ¥358,851 ¥ — ¥279,009 ¥279,009 ¥ —
Notes and accounts receivables-trade 310,694 311,221 527 253,237 253,225 (12)
Short-term investment securities and
Investment securities
Available-for-sale securities
Investments in afliates
863,514
513 863,514
252 —
(261)738,687
513
738,687
357
—
(155)
Total of assets 1,533,573 1,533,838 265 1,271,448 1,271,279 (168)
Accounts payable-trade 433,819 433,819 —350,472 350,472 —
Short-term loans payable 197,413 197,413 —171,790 171,790 —
Current portion of long-term loans payable
38,748 38,779 (31)35,299 35,313 (14)
Accrued expenses
171,274 171,274 —155,519 155,519 —
Long-term loans payable 209,166 207,874 1,291 220,392 218,067 2,324
Total of liabilities 1,050,421 1,049,160 1,260 933,474 931,164 2,310
Derivatives
Hedge accounting is applied
Hedge accounting is not applied
51
1,160 51
1,160 —
—2,596
(1,845)
2,596
(1,845)
—
—
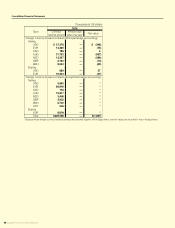
Thousands of US dollars
2014
Carrying
amount Fair value Difference
Cash and deposits $3,486,699 $3,486,699 $ —
Notes and accounts receivables-trade 3,018,792 3,023,913 5,121
Short-term investment securities and
Investment securities
Available-for-sale securities
Investments in afliates
8,390,152
4,989 8,390,152
2,448 —
(2,541)
Total of assets 14,900,634 14,903,215 2,580
Accounts payable-trade 4,215,115 4,215,115 —
Short-term loans payable 1,918,122 1,918,122 —
Current portion of long-term loans payable
376,487 376,791 (304)
Accrued expenses
1,664,151 1,664,151 —
Long-term loans payable 2,032,319 2,019,765 12,553
Total of liabilities 10,206,195 10,193,946 12,249
Derivatives
Hedge accounting is applied
Hedge accounting is not applied
504
11,280 504
11,280 —
—
(*): Assets or liabilities derived from derivatives are shown on a net basis and net liabilities are shown as ( ).